Kathryn Chen*, Michael J. Fleming, John Jackson*, Ada Li* and Asani Sarkar
The credit default swap (CDS) market has grown rapidly since the asset class was developed in the 1990s. In recent years, and especially since the onset of the financial crisis, policymakers both in the United States and abroad have begun to strengthen regulations governing derivatives trading, with a particular focus on the decentralized and opaque nature of current trading arrangements. For example, the Dodd-Frank Act will require U.S.-based market participants to publicly report details of their CDS trades. In this post, we discuss the possible impact of increased transparency in the CDS market, based on our recent analysis of new and detailed data on the trading activity of major dealers. (See also new video coverage of our findings.)
The introduction of mandatory trade reporting rules for CDS has a number of potential costs and benefits. Providing more information on traded prices may be valuable to investors who wish to transact at a fair price; it can also enable risk managers to more accurately measure the riskiness of their positions. Regulators also believe that greater transparency, together with increased trading on organized platforms and clearing by a central counterparty, will improve market stability and functioning along a number of dimensions. The most notable potential cost is the risk that market participants will adjust their prices to take advantage of the knowledge that a dealer involved in a trade will need to hedge a position. This result could increase the costs of market making, causing trading costs for customers to rise.
The benefits of transparency in the CDS market are likely to be greater to the extent that reported prices are comparable over time for similar CDS transactions. For this to happen, contractual terms of CDS contracts, which are negotiated bilaterally between buyers and sellers, cannot vary substantially from trade to trade. In fact, our analysis of single-name CDS trades (which provide protection against the default of a specific bond issuer) reveals an impressively high level of standardization of contract terms and market conventions. We find that 92 percent of CDS trades have a standard coupon and 97 percent have fixed quarterly payment dates. This information suggests that recent industry reforms aimed at increasing standardization in the CDS market, particularly the introduction of “Big Bang” and “Small Bang” protocols in 2009, have been successful.
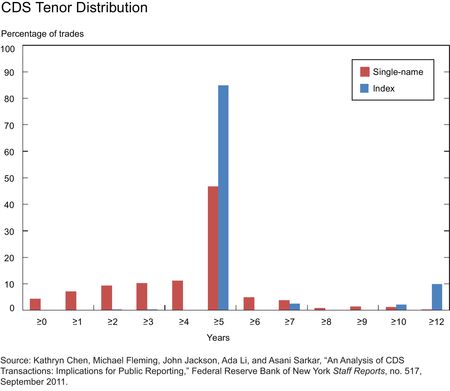
Other evidence of standardization can be seen in CDS contract maturities. As shown in the chart below, 47 percent of single-name transactions and 84 percent of index trades (which provide protection against the default of a group of bond issuers) are in the five-year tenor.
The price discovery benefits of trade reporting are likely related to the frequency of trading activity for a given instrument. If most CDS contracts trade sparsely, then little useful price discovery information may be gleaned from observing the occasional trade in real time. We find that the level of trading activity in the CDS market is strikingly low. In aggregate, single-name CDS contracts written on corporate and sovereign issuers trade only 3,000 times per day, on average, across more than 1,500 distinct corporate and government issuers. This frequency is comparable to the level of trading in corporate bonds (Bao, Pan and Wang 2011). By contrast, the New York Stock Exchange handled an average of over 10 million trades per day between May and July 2010, across close to 3,000 securities, with the average stock traded more than 3,000 times.
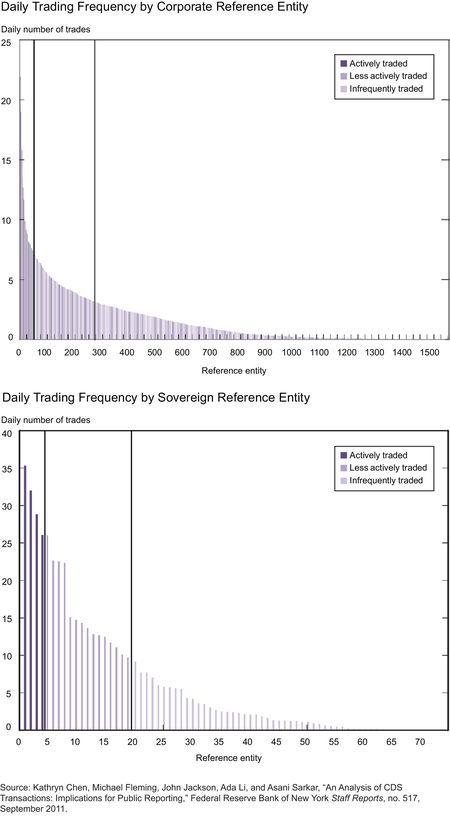
While CDS are thinly traded compared with other financial instruments, there is significant variation across issuers, as shown in the two charts below. A small number of corporate CDS trade over ten times per day, and the most actively traded sovereign CDS trade thirty times a day, while the majority of contracts trade less than once daily. While trading activity is concentrated in contracts on a small number of bond issuers, the specific entities generating the most trading activity vary over time. Therefore, the impact of reporting rules could vary significantly across CDS and over time.
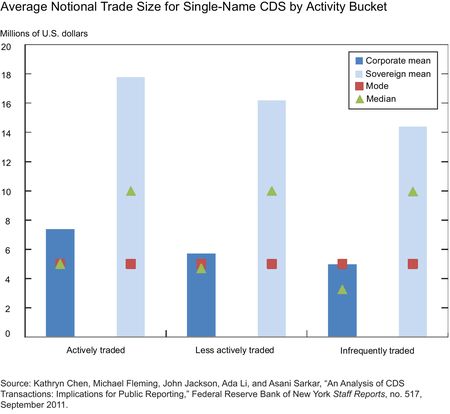
Despite the low frequency of CDS trading, the typical size of CDS trades is large and remarkably consistent across reference entities (see chart below). The most frequently traded notional size for single-name CDS is 5 million for both dollar- and euro-denominated contracts, with very little variation in trade size between the most actively traded and infrequently traded reference entities. The occurrence of large trades in relatively inactive contracts illustrates the important role CDS dealers play in facilitating trading in these contracts. If increased transparency reduces the willingness of dealers to intermediate trades, then it could reduce the incentive for other participants to trade in these markets.
To provide insight into the potential cost of increased transparency for dealers’ market-making activity, we examined the extent to which dealers rapidly offset a new CDS position. We first identified days on which dealers engage in a large trade with a customer (that is, one that is larger than 95 percent of all trades for that CDS contract in our sample). We found that on 47 percent of these large-trade days, dealers did not make any offsetting trades in the same reference entity. When dealers did make additional trades in the same contract, they made an average of 2.7 additional trades in the opposite direction of the large trade, compared with 2.8 in the same direction. The scarcity of offsetting trades observed even for the most actively traded contracts suggests that it is not solely due to the difficulty finding trading counterparties.
This analysis, along with anecdotal evidence on market practice, suggests that dealers do not rapidly hedge the risk associated with their CDS trades (although we didn’t consider whether they used different instruments to hedge this risk). However, the implications of this finding for the likely impact of increased transparency are ambiguous. On the one hand, it might be interpreted as mitigating the concern that introducing price reporting would hinder dealers’ ability to hedge their risks. On the other hand, it may be seen as evidence that price reporting would need to be delayed for a number of days to avoid impeding hedging activity.
&n
bsp; Data on trading activity in the CDS market paint a mixed picture of the likely impact of trade reporting rules. The high levels of standardization of trading and contractual terms are apt to enhance the ability of market participants and policymakers to interpret the reported transactions. However, the low frequency of trading diminishes the potential price discovery benefits of real-time trade reporting. Evidence that trade sizes do not vary significantly with trade frequencies illustrates the important role dealers currently play, but the finding that dealers rarely hedge large trades immediately makes it difficult to assess how their role might be affected by greater transparency. What is clear is that trade reporting rules will need to be carefully designed to suit the structure of the CDS market.
*Kathryn Chen is an assistant vice president in the Markets Group and Ada Li a senior bank examiner in the Financial Institution Supervision Group (FISG) of the Federal Reserve Bank of New York; John Jackson is on secondment to FISG from the Bank of England.
Disclaimer
The views expressed in this blog are those of the author(s) and do not necessarily reflect the position of the Federal Reserve Bank of New York, or the Federal Reserve System. Any errors or omissions are the responsibility of the author(s).


 RSS Feed
 Follow Liberty Street Economics
In response to Darrell Duffie’s comment on hedging, we agree that a full understanding of this issue would require analysis that goes beyond the limitations of our data set. For example, the observed speed of hedging doesn’t tell us how fast dealers could hedge if the existence of trade reporting made this more urgent. Nevertheless, Darrell’s conclusion that a delay of hours rather than minutes would greatly reduce the risk of harming market liquidity seems reasonable. In response to Darrell’s comment on tenors, we were also surprised about the low fraction of five-year trades. One partial explanation might be that a significant fraction of the shorter-dated transactions are entered into as offsets to existing open positions (e.g., a three-year trade in the opposite direction to an open position with three years left to maturity). This is an idea suggested in the Dealbreaker blog (http://dealbreaker.com/2011/09/cds-levels-may-not-be-the-all-purpose-indicator-that-wsj-thought-they-were-reports-wsj/) in a post about our paper. It is not something that we are able to directly test in our data, but may help to explain the relatively low levels of terminations and assignments (13 percent of transactions) we observed. Unfortunately, we don’t have access to any additional data that could enable us to examine how the tenor distribution has evolved over time. We will investigate further Darrell’s interesting suggestions about how to expand our concentration analysis to shed additional light on concerns about oligopolistic behavior.
The issue of appropriate delay in public disclosure of transactions for large trades is somewhat complex. If there are rarely reversing trades on the same day, then whether delaying 15 minutes or 1.5 hours, or delaying to end of day, it seems to make little difference. I think that is your point, right? Also, there is likely to be endogeneity. If trades were reported publicly at a given time lag of X, would that change hedging behavior? Probably. Perhaps you would get some increased hedging that occurs within the private time window of length X, so as to mitigate adverse selection. But in that case, one may be stressing the traders and the choice of time of original trade if one chooses X=15 minutes. Widening the large-trade reporting time lag to a half day or a day would allow more time to get the hedge in place without adverse selection. That might improve market liquidity. This is purely speculative on my part. Thanks for the great paper!
Fantastic paper. Very useful indeed. I am definitely giving it to my class as a reading assignment! These comments are from an earlier draft, so may be out of date. The concentration among the G14 dealers is low. But considering that all bilateral trades among hundreds of participants go through 14 investors represents a lot of market concentration. That’s all clear from your paper, but some might assume the “low concentration” result should ease concerns about oligopolistic behavior. Can you also compare Herfindahls among all market participants, and how that varies from segment to segment of the market? The fraction of single-name trades at 5 years, 43%, was lower than I expected. Prior estimates, as I recall, were much higher for corporates. Is the market changing? This has implications favoring central-clearing-based netting. Does clearing eligibility lead to higher trade frequency, or is causality the opposite way? I would expect the opposite. No issues with the result as reported, but it may be worth commenting on the selection effect.
Transparency would lead to better information, which leads to more efficient markets. As you noted, this would decrease the moral hazard by making information more symmetrical. In the end it will effect profits, making the CDS market less attractive.