Jason Bram and Richard Deitz
February’s Empire State Manufacturing Survey (ESMS) indicates that manufacturing activity in New York State continued to expand for a third consecutive month. The survey’s headline index rose an encouraging six points to 19.5, its highest level in more than a year. Other indicators in the report show steady growth in orders, shipments, and employment, and fairly widespread planned increases in capital spending. In this post, we take a closer look at the recent results of the survey, which indicate that growth in New York’s manufacturing sector has rebounded in recent months from its decline during the summer and fall of 2011.
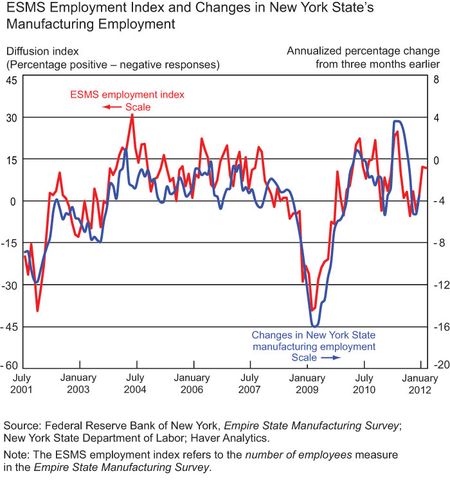
One reason that we find today’s report encouraging is that the survey’s jobs index has been sending some positive signals. So far in 2012, manufacturers have reported more favorable employment trends than in the second half of 2011. Since the index tends to move in parallel with manufacturing employment for the state as a whole, these findings may foreshadow some improvement in New York’s employment numbers.
The chart below plots the ESMS employment index together with the annualized growth rate in manufacturing jobs in New York State. While manufacturing jobs over the last decade have generally declined, there were periods of growth during much of 2010 and again in the spring of 2011—and during these times the employment index rose. Although the index hasn’t reached a level indicating expanding manufacturing employment (that would take a level of about 15), it does suggest that the pronounced weakness in jobs we saw during the second half of 2011 may have abated.
On the pricing front, the February report indicates that input prices have continued to rise, but considerably less than during the first half of 2011 when energy prices were climbing rapidly. As for selling prices, the pace of increase has picked up somewhat compared with the second half of 2011, though price increases remain moderate.
Moving from present conditions to the outlook for the next six months, we find that manufacturers remain quite optimistic about business prospects. In particular, considerably more than a third of those surveyed plan to add workers, and capital spending is expected to rise at a good clip.
Supplementary questions in the February survey focused more specifically on manufacturers’ capital spending plans. Slightly more than 45 percent of respondents say that they plan to invest more in 2012 than in 2011, while just 25 percent plan to spend less than last year. Overall, the median expected level of capital spending for 2012 is up 29 percent from the actual level reported for 2011. When asked what factors are contributing to higher capital spending in 2012, a majority of respondents indicated a need for labor-saving equipment and favorable trends in sales and demand.
Disclaimer
The views expressed in this blog are those of the authors and do not necessarily reflect the position of the Federal Reserve Bank of New York or the Federal Reserve System. Any errors or omissions are the responsibility of the authors.


 RSS Feed
 Follow Liberty Street Economics