Stefania Albanesi, Ayşegül Şahin, and Joshua Abel*
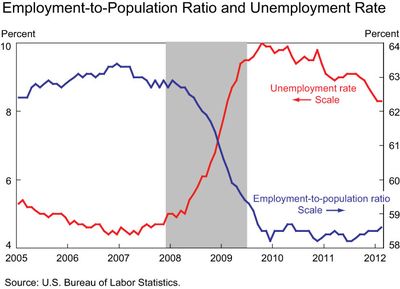
The contrasting movements in the employment-to-population ratio (E/P) and the unemployment rate recently have been striking and puzzling. The unemployment rate has declined 1.7 percentage points since the unemployment peak in October 2009, but the E/P ratio has increased only 0.1 percentage point.
What is missing from the chart above is labor force participation. In this post, we show that changing long-term trends and cyclical behavior in participation—especially among women—are key to understanding the recent behavior of the labor market. Going forward, we expect that women’s participation decisions will continue to be an important factor driving labor force participation and unemployment.
The Changing Role of Participation in Business Cycles
To link these pieces together, recall from the post by McCarthy and Potter that we can express the change in the unemployment rate as
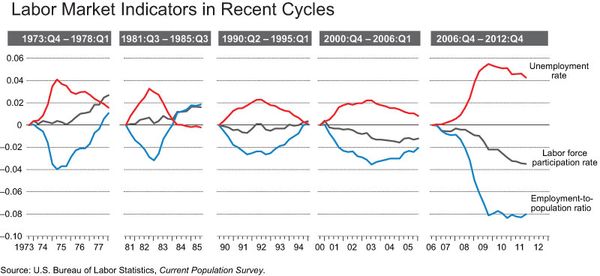
Using this decomposition, we examine the behavior of these three variables around each recession since 1973 (except the 1980 recession). In each case, we start from the unemployment trough of the preceding expansion and end three years after the unemployment peak.
This figure shows that labor force participation was flat-to-rising during the cycles associated with the 1973-75, 1981-82, and 1990-91 recessions. In those cases, a declining unemployment rate was associated with a rising E/P ratio, so those variables were providing consistent signals about labor market conditions. On the contrary, in the cycles associated with the 2001 and 2007-09 recessions, labor force participation declined. Consequently, declines in the unemployment rate have been associated with little increase in the E/P ratio, so those variables have provided contrasting signals about the labor market. Of course, this situation has been particularly true in the current cycle.
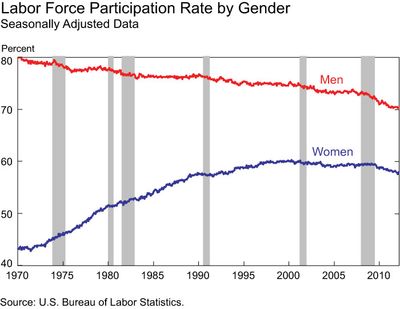
To understand these patterns, we need to step back and examine the trends in labor force participation for both women and men. The female participation rate increased steadily beginning in the 1930s, and especially in the postwar period, driven by the behavior of married women. The rate then stabilized at around 60 percent from the mid-1990s (when we saw the change in the cyclical pattern) to 2009, and then has declined some (see Albanesi and Prados [2011]). In contrast, the participation rate for men has steadily declined in the postwar period.
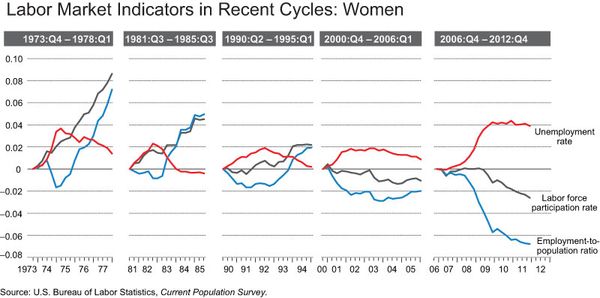
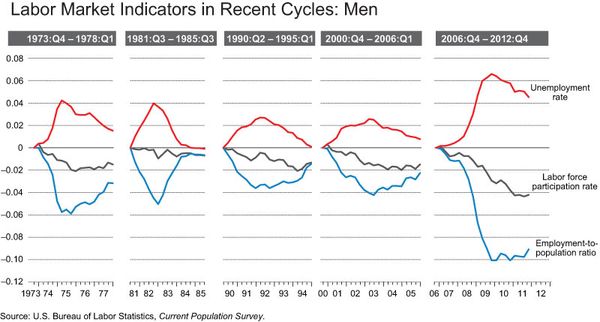
These participation trends affect the relationship between the unemployment rate and the E/P ratio over the cycle. To illustrate, the next two figures repeat our unemployment rate decomposition for women and men separately.
In the 1973-75 and 1981-82 recessions, women continued to enter the labor force, maintaining the trend of that time. Thus we see, after an initial dip during these recessions, a rapid increase in the E/P ratio for women in the recoveries. The rise in female labor force participation also largely offset the decline in male participation in these cycles, resulting in a tight negative relationship between the aggregate unemployment rate and E/P ratio during those periods.
However, in the 2001 and 2007-09 recessions—when the upward trend in female participation had stopped—female participation was roughly flat but dropped in the subsequent recoveries. Male participation in those recessions displayed similar declining patterns as in the previous business cycles. As a consequence, we see that the aggregate unemployment rate has fallen more quickly compared with the improvement in the E/P ratio during these recoveries.
In the current cycle, the E/P ratio for women has continued to fall in the recovery, while those for men have stabilized. Therefore, even though the female unemployment rate did not rise as much during the recession as did the male rate, it has declined very little in the recovery so far.
What may have led to these gender differences? The relative stability of female participation during recessions and declines in the recoveries of the last two cycles point to an “added worker” effect—the tendency of secondary earners in the household, typically wives, to enter the labor force to replace forgone income caused by the job loss of primary earners, typically husbands (Juhn and Potter 2007).
The Role of Industry Composition
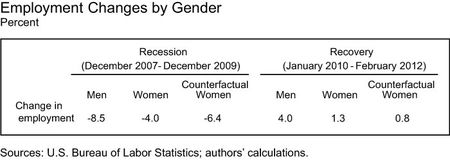
Our charts also show that the cyclical variation in unemployment is more pronounced for men than for women. One reason may be that men are more likely to work in more cyclical industries, such as manufacturing and construction, while women tend to work in less cyclical sectors, such as education and health care. To examine the role of industry composition for the most recent recession, we assume a hypothetical situation where women are employed across industries in the same manner as men and then compute the change in employment based on female-specific job losses in each industry. As shown below, industry composition accounts for about half of the gender difference in job losses during the recession. Given that gender differences have narrowed over time, this factor probably played a more prominent role in earlier recessions (for more, see Albanesi and Şahin [2011], and Şahin and Willis [2011]).
During the recovery so far, most job gains have gone to men. However, even though government employment—where a sizable proportion of women are employed—has been weak, industry composition has not played much of a role in the slow growth of female employment. In fact, repeating our hypothetical exercise for the recovery, the increase in female employment would have been even less than it has been.
Where Do We Go from Here?
Our analysis suggests that a key factor for future aggregate labor force participation is the behavior of married women, who have been the main drivers of the long-run trends discussed in this post. The rise in their participation until the early 1990s and subsequent stability through 2009, along with the sharp rise in women’s college graduation rates, points to a pool of highly skilled women who are not currently participating in the labor market. If labor market conditions improve sufficiently to attract them into the labor force, the result could be increased productivity. However, recent research suggests that growth of male earnings has tended to reduce the participation of skilled married women (Albanesi and Prados 2011). If this effect dominates, participation might decrease further.
While women’s participation decisions have been the main driver behind long-term changes in the overall labor force participation rate during the postwar era, the aging of the population is another important demographic factor that has begun to exert its influence. See the interactive chart “Labor Market Indicators by Gender, Age, and Recession Period” for a fuller understanding of how these demographic factors affect labor market activity. Going forward, the aging population is likely to put downward pressure on the participation rate. Therefore, unless the female participation rate begins to rise again, long-term employment growth is likely to decline further, as discussed in a recent paper by Stock and Watson.
*Joshua Abel is a research associate in the Research and Statistics Group.
Disclaimer
The views expressed in this blog are those of the authors and do not necessarily reflect the position of the Federal Reserve Bank of New York or the Federal Reserve System. Any errors or omissions are the responsibility of the authors.



 RSS Feed
 Follow Liberty Street Economics
A well research post indeed! Keep on posting for more.
Really a great post on your blog.Thanks for explaining about the new portal.