


Marco Del Negro, Daniel Herbst,* and Frank Schorfheide
Dynamic stochastic general equilibrium (DSGE) models have been trashed, bashed, and abused during the Great Recession and after. One of the many reasons for the bashing was the models’ alleged inability to forecast the recession itself. Oddly enough, there’s little evidence on the forecasting performance of DSGE models during this turbulent period. In the paper “DSGE Model-Based Forecasting,” prepared for Elsevier’s Handbook of Economic Forecasting, two of us (Del Negro and Schorfheide), with the help of the third (Herbst), provide some of this evidence. This post shares some of our results.
We find that it really matters what information you feed into your model: Feed in the right information, and even a dingy DSGE model may not do so poorly at forecasting the recession. We also compare how the models perform relative to the “Blue Chip Economic Consensus” forecasts. The answer is: About the same, if not better, in fall 2007, in summer 2008, before the Lehman crisis, and at the beginning of 2009–provided one incorporates up-to-date financial data into the DSGE model. (By the way, if you don’t know what a DSGE model is, check out Wikipedia or this primer.)
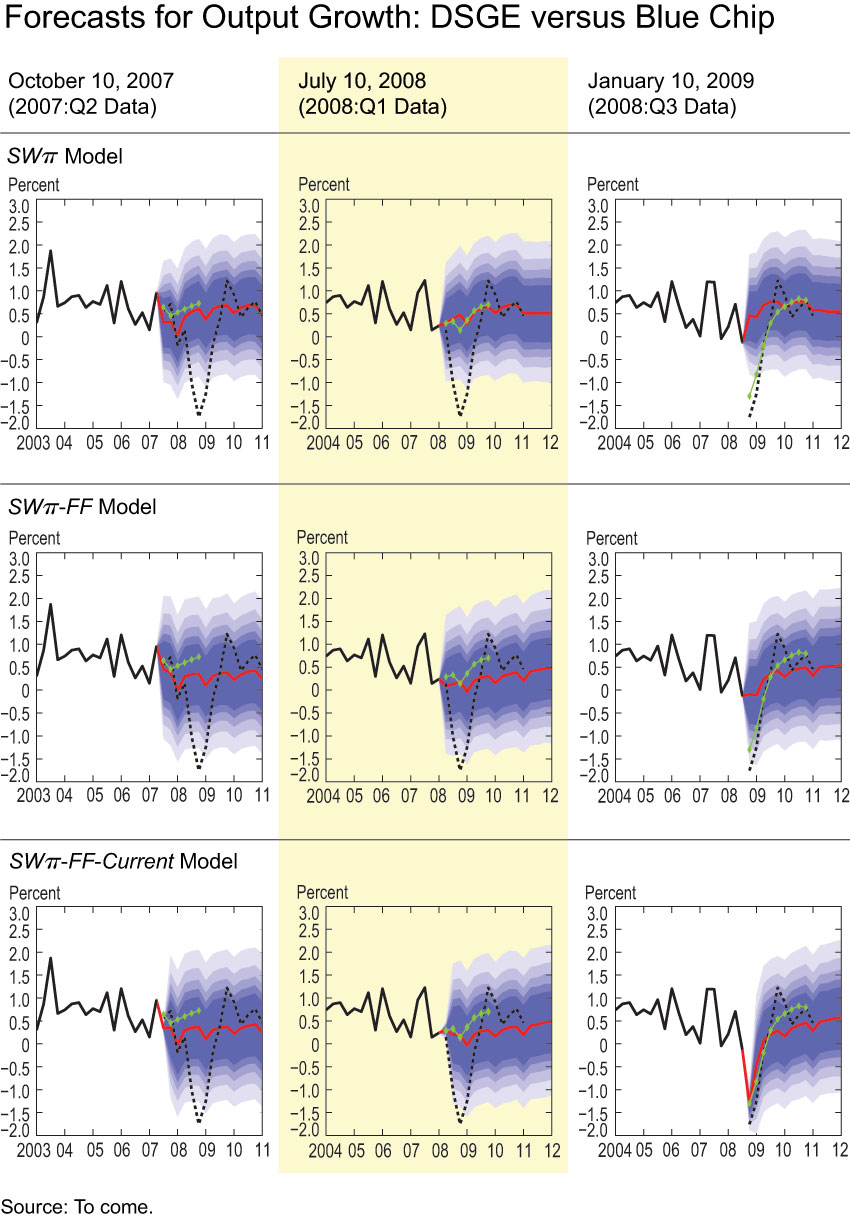
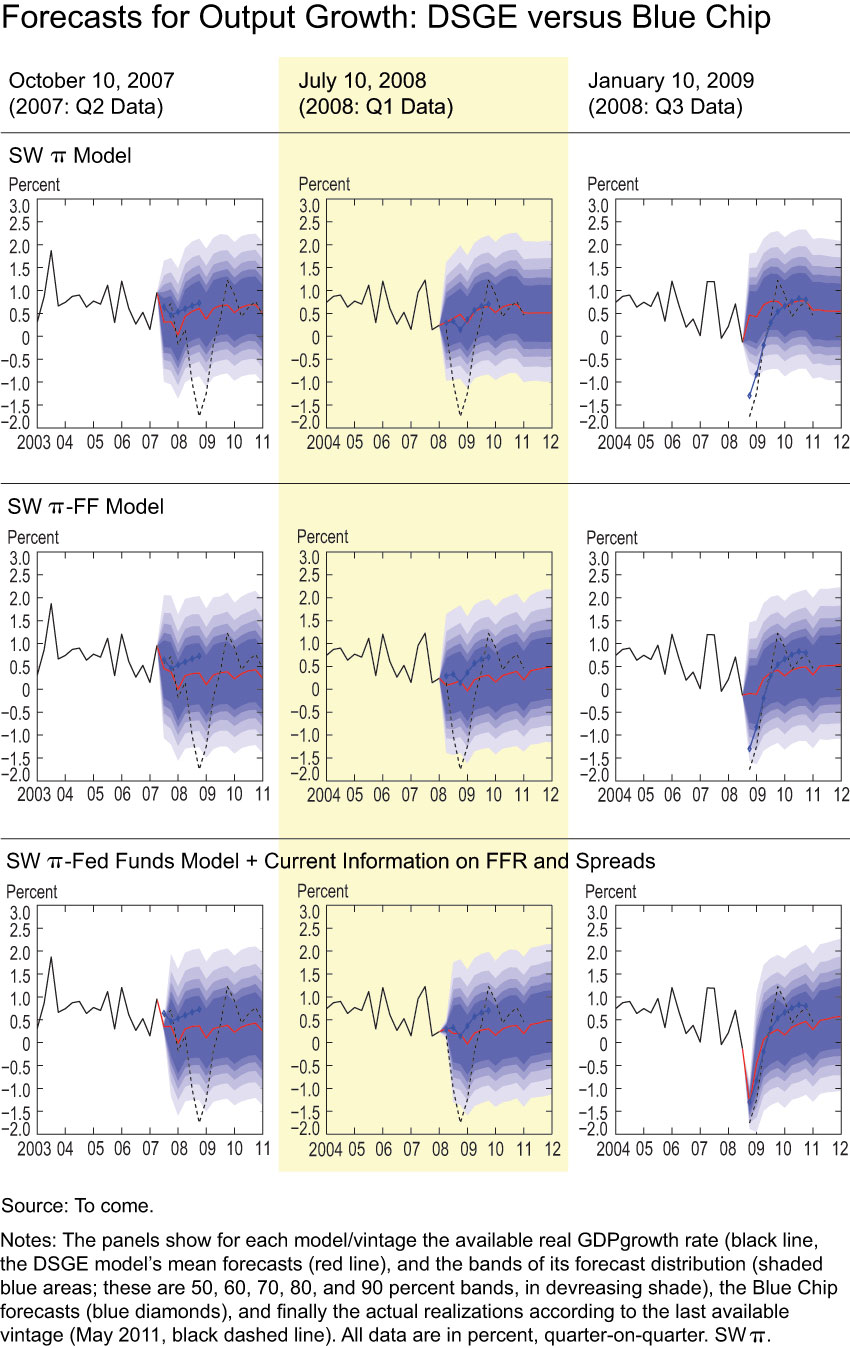
The chart below shows DSGE model and Blue Chip forecasts for output growth obtained at three junctures of the crisis (the dates coincide with Blue Chip forecast releases): October 10, 2007, right after the turmoil in the financial markets had begun in August of that year; July 10, 2008, not long before the default of Lehman Brothers; and January 10, 2009, at the apex of the crisis. Specifically, each panel shows the current real GDP growth vintage (solid black line), the DSGE model’s mean forecasts (red line), and bands of the forecast distribution (shaded blue areas; these are the 50, 60, 70, 80, and 90 percent bands for the forecast distribution, in decreasing shade), the Blue Chip forecasts (green diamonds), and the actual realizations according to the May 2011 vintage (dashed black line). All the numbers are in percent, quarter-over-quarter.

When interpreting these results, bear in mind that the information available to the DSGE econometrician consists only of the data used for estimation that are available at the time of the forecasts (these data are real GDP growth; inflation; the federal funds rate; total hours worked; growth in real wages, investment, and consumption; and long-run inflation expectations–all at a quarterly frequency). This implies two things. First, the estimation is done in a “real-time” context (as opposed to using revised data–yes, the GDP growth and other data are revised all the time, so the numbers you read about in the paper often end up being quite different from the final numbers). Second, the DSGE econometrician has only lagged information on the state of the economy. For instance, on January 10, 2009, she would only have the information contained in 2008:Q3 data. The information set used by Blue Chip forecasters contains the same data, but also includes a plethora of current indicators on the quarter that just ended (namely, 2008:Q4), information from financial markets, and all the qualitative information available from the media, speeches by government officials, etc.
The chart shows the forecasts for three different DSGE specifications. We call the first one SWπ; this is essentially the popular Smets-Wouters model. The second is the Smets-Wouters model with financial frictions, as in Bernanke et al. and Christiano et al., which we call SWπ-FF. The other difference between this model and SWπ is the use of observations on the Baa-ten-year Treasury rate spread, which captures distress in financial markets.
The last specification is still the SWπ-FF, except that we use observations for the federal funds rate and spreads for the quarter that just ended and for which no National Income and Product Accounts data are yet available (for the January 10, 2009, forecasts, these would be the 2008:Q4 average fed funds rate and spreads). Of course, this information was also available to Blue Chip forecasters. We refer to this specification as SWπ-FF-Current.
The October 10, 2007, Blue Chip forecasts for output were relatively upbeat, at or above .5 percent quarter-over-quarter (that is, 2 percent annualized). The SWπ forecasts were more subdued: The model’s mean forecasts are for growth barely above zero in 2008:Q1, with some probability of negative growth in 2008–that is, a recession. The forecasts for the two SWπ-FF specifications were in line with those of the SWπ model, although a bit more subdued. SWπ-FF-Current in particular assigns a likelihood of negative growth that’s above 25 percent. These models capture the slowdown in the economy that occurred in late 2007 and early 2008, but of course miss the post-Lehman episode. The decline in real GDP that occurred in 2008:Q4 is far in the tails of the forecast distribution for the SWπ model, but less so for the two SWπ-FF specifications.
In July 2008, the Blue Chip forecast and the mean forecast for the SWπ model were roughly aligned. Both foresaw a weak economy–but not a recession–in 2008, and a rebound in 2009. The two SWπ-FF specifications were less sanguine: Their forecast for 2008 was only slightly more pessimistic than the Blue Chip’s for 2008; but, unlike the Blue Chip, these models did not foresee a strong rebound in the economy in 2009. Both models failed to grasp what was coming in 2008:Q4, but at least they put enough probability on negative outcomes that the economy’s strikingly negative growth rate in 2008:Q4 is almost within the 90 percent bands of their forecast distributions.
By January 2009, conditions had worsened dramatically: Lehman Brothers had filed for bankruptcy a few months earlier (September 15, 2008), stock prices had fallen, financial markets were in disarray, and various current indicators had provided evidence that real activity was tumbling. None of this information was available to the SWπ model, which on January 10, 2009, would have used data up to 2008:Q3. Not surprisingly, the model is, so to say, in “la-la land” concerning the path of the economy in 2008:Q4 and after. Unlike the SWπ model, the SWπ-FF specification does not forecast a rebound, but at the same time does not foresee the steep decline in growth that occurred in 2008:Q4. The SWπ-FF uses spreads as an observable, but since the Lehman bankruptcy occurred only later in Q3, it had minor effects on the average Baa-ten-year Treasury rate spread for the quarter, and therefore the SWπ-FF has little indirect information on the turmoil in the financial markets.
The forecasts of the SWπ-FF-Current specification, which uses 2008:Q4 observations on spreads and the fed funds rate, are a completely different story. The model produces about the same forecast as the Blue Chip for 2008:Q4. Considering that the agents in the laboratory DSGE economy had not seen Federal Reserve Chairman Bernanke and Treasury Secretary Paulson on TV painting a dramatically bleak picture of the U.S. economy–which the Blue Chip forecasters likely did see–we regard this as a small achievement. But the main lesson may be that structural models can actually produce decent forecasts as long as you’re using appropriate information.
*Daniel Herbst is an assistant economist at the Federal Reserve Bank of New York; Frank Schorfheide is a professor of economics at t
he University of Pennsylvania.
Disclaimer
The views expressed in this post are those of the authors and do not necessarily reflect the position of the Federal Reserve Bank of New York or the Federal Reserve System. Any errors or omissions are the responsibility of the authors.
 RSS Feed
 Follow Liberty Street Economics