Joshua Abel,* Robert Rich, and Joseph Tracy
As Europe continued to struggle with its sovereign debt crisis during the past two years, significant concerns about the growth outlook for European Union members began to emerge in late 2011. In response, the European Central Bank (ECB) and European authorities carried out a series of important policy initiatives. In this post, we use growth forecasts from an ECB survey to document the deterioration in the growth outlook and note parallels to late 2008—when Europe was in a deep recession. We also discuss how the next survey scheduled for release in May can be used to gauge whether recent policy actions have improved the growth outlook and reduced the uncertainty surrounding it.
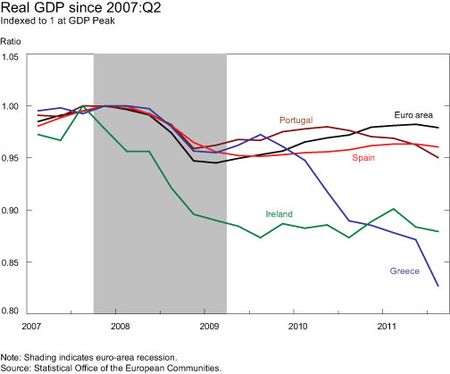
As seen in the chart below, real GDP in Europe is still several percentage points below its peak prior to the recession that extended from first-quarter 2008 to second-quarter 2009 (indicated in grey shading).
The chart also shows that the current economic situation is much weaker in several euro-area periphery countries. The recession in Greece has yet to end, and real GDP is now more than 17 percent below its prior peak. While a recovery recently appeared to be under way in Ireland, real growth is still 12 percent below peak. Portugal’s economic contraction during 2008-09 was less severe than that for the euro area. However, Portugal’s recovery faltered in mid-2010, and the economy has been contracting since then. Spain also experienced a milder recession than the euro area, but its recovery began later and has been progressing at a slower pace, leaving it around 4 percent below peak.
One useful source of information on the European growth outlook is the quarterly ECB Survey of Professional Forecasters (ECB-SPF). Like its American counterpart, the ECB-SPF asks participants for both their point forecasts and density (histogram) forecasts for growth. The density forecasts indicate the certainty that participants feel about their point forecasts and also reflect their concerns about tail risks—outcomes that may be very far away from their point forecast.
The most recent ECB-SPF was collected from January 17 to 20, 2012. The ECB-SPF asks participants for a one-year-ahead growth forecast (currently covering third-quarter 2011 to third-quarter 2012 because of publication lags for GDP) and a one-year/one-year-forward growth forecast (currently covering third-quarter 2012 to third-quarter 2013). As we will see, the survey showed a marked deterioration in the outlook along several dimensions and revealed a number of similarities to the fourth-quarter 2008 survey.
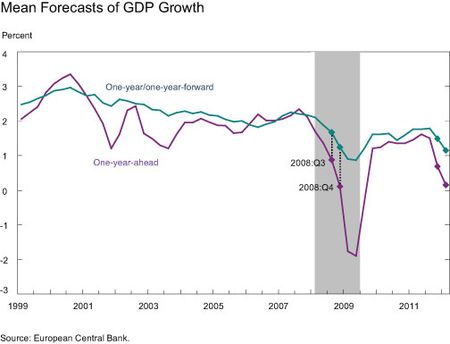
The next chart plots the mean growth point forecasts across participants since 1999 for both horizons. Since the previous survey, which was collected in mid-October, participants have become more concerned about the growth outlook. The one-year-ahead mean point forecast declined sharply from 0.7 percent to 0.2 percent. The survey participants also indicated that the factors weighing on their growth forecasts are expected to persist for a while, as evidenced by the one-year/one-year-forward mean forecast declining from 1.5 percent to 1.2 percent.
As the chart also shows, the last time these mean growth forecasts were at this level was in fourth-quarter 2008, when Europe was in the middle of a recession.
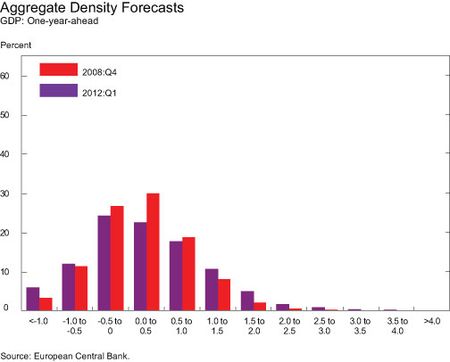
There are other parallels between the most recent ECB-SPF survey and the fourth-quarter 2008 survey. The aggregate density forecasts shown above, which are an average of the participants’ histograms, are remarkably similar and indicate that participants are assigning significant probability to negative growth. (In the case of the fourth-quarter 2008 survey, actual GDP growth for second-quarter 2008 to second-quarter 2009 was -4.6 percent—an outcome far more severe than that indicated by even the most pessimistic participants.)
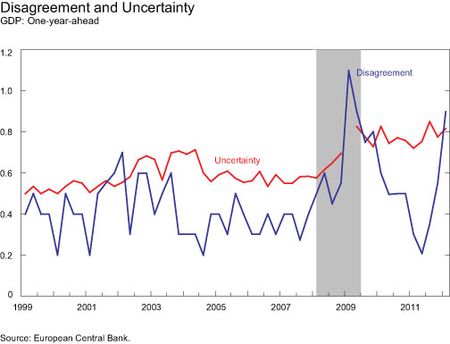
The aggregate histogram will be more spread out in periods in which there is greater disagreement among participants in their growth point forecasts, greater uncertainty by the participants in their growth forecasts, or both. As shown below, disagreement among forecasters rose sharply in the prior recession. We measure disagreement by the spread between the 75th and the 25th percentiles of the ranked distribution of point forecasts. We see that disagreement has also been rising sharply over the last three surveys and is currently at a level similar to late 2008. We measure the uncertainty that participants attach to their point forecasts based on the degree of spread in their density forecasts. Average uncertainty rose throughout the past recession and has remained high to the present. Compared with the fourth-quarter 2008 survey, disagreement and uncertainty are actually higher in the first-quarter 2012 survey.
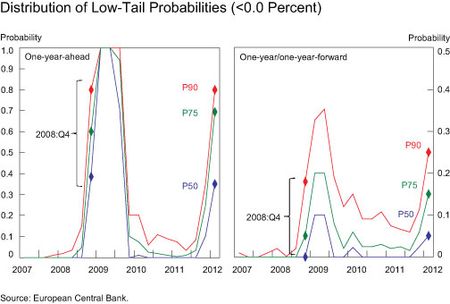
As noted, the density forecasts can be used to measure the risk of negative growth outcomes over an indicated forecast horizon. We can measure the probability each participant assigns to this negative growth event, rank the forecasters by the size of their probabilities, and then summarize this distribution by looking at specific percentiles. The left panel of the next chart shows the history of the 90th percentile (90 percent of the probabilities are lower), 7
5th percentile (75 percent of the probabilities are lower), and the 50th percentile (50 percent of the probabilities are lower) for negative GDP growth over the one-year-ahead forecast horizon. The right panel of the same figure shows similar negative growth probability assessments, but for the one-year/one-year-forward horizon.
In the left panel, the 90th percentile participant assigned an 80 percent probability to negative growth. As we move down to the 75th percentile participant, the probability declines slightly from 80 percent to 70 percent. Finally, the 50th percentile (or median) participant assigned a 35 percent probability to negative growth over the one-year horizon. These numbers are notable given that these percentiles seldom deviate from 0, with the exception of the deep recession in 2008-09. In fact, you can again notice that these negative growth probability assessments are virtually identical to those from the fourth-quarter 2008 survey.
If we turn now to the one-year/one-year-forward horizon, the 90th percentile participant is assigning a 25 percent probability that European growth will be negative between third-quarter 2012 and third-quarter 2013. This is significantly more pessimistic than the 90th percentile from the fourth-quarter 2008 survey, which was 18 percent. Similarly, the 75th and 50th percentile participants are more pessimistic about growth in the future than similar participants were in late 2008. Once again, the previous recession is the only precedent for the high observed values of these measures over the short history of the ECB-SPF.
In response to developments that may have helped shape the ECB-SPF participants’ expectations, a number of important policy initiatives have been undertaken. In terms of timing, one action preceded the first-quarter 2012 survey and two occurred subsequent to it. For example, the most recent ECB-SPF was conducted well after the ECBs first Long-Term Refinancing Operation (LTRO) conducted in late December for slightly less than €500 billion in three-year bank funding. Since the latest ECB-SPF survey, the ECB conducted a second round of LTRO on February 29 that brought the total ECB liquidity injection to more than €1 trillion. In addition, European authorities have agreed to another round of emergency financing for Greece, including significant haircuts for private investors.
In light of these recent policy developments, it is possible that the picture in Europe has brightened. Moreover, in the current environment characterized by high forecaster uncertainty, the outlook is likely to be particularly sensitive to the flow of data and events in Europe. If the outlook has improved, then the next ECB-SPF survey may reveal participants maintaining or revising up their growth forecasts. Alternatively, participants may initially respond by reducing their uncertainty or lowering the probabilities they associate with negative growth outcomes at the one-year/one-year forward horizon, perhaps even extending the reduction to the one-year-ahead horizon. The possibility remains, however, that despite these policy interventions, the near-term evolution of the ECB-SPF forecasts may continue to follow the path of 2008-09. The next ECB-SPF survey, collected this month and released in May, will provide an interesting read on the European growth outlook and its risks.
*Joshua Abel is a research associate in the Research and Statistics Group.
Disclaimer
The views expressed in this post are those of the authors and do not necessarily reflect the position of the Federal Reserve Bank of New York or the Federal Reserve System. Any errors or omissions are the responsibility of the authors.


 RSS Feed
 Follow Liberty Street Economics
It would seem that monetary policy has its limitations going forward. The 2012 election may help with direction as our economic issues are finally reaching the general public’s interest. D
The Eurozone seems destined to collapse from a lack of demand in the consumer sectors. This is likely to make it near impossible to increase tax revenues and GDP. Could a break-up of the union help with management of these problems? The USA according to this website is in similar shape: http://www.usdebtclock.org. It seems like growth can not reach the levels necessary to pay back our debts. I don’t think that QE policies will help as the issue is demand and confidence (in my opinion). D