


Nora Fitzpatrick, Andrew F. Haughwout, and Elizabeth Setren
With July just around the corner, most cities and states are preparing for the start of a new fiscal year. Since the start of the recent recession, some have worried that fiscal stress on the sector would result in massive municipal bond defaults. At the end of 2011, many breathed a sigh of relief as aggregate state government revenues finally re-attained the peak they had achieved before tumbling during and after the recession. Unfortunately, relief may be premature. When adjusted for inflation, 2011 state tax revenues were still below their levels of four years ago, and local tax revenue continues to decline. In this post, we explore how the state and local public sector functions as part of the broader economy, how it responded to the most recent downturn, and why it could potentially be a drag on economic activity for years to come.
What Do State and Local Governments Do?
State and local governments are a very important part of the U.S. economy. The sector employs nearly 20 million people, accounting for about one in seven U.S. nonfarm jobs and more than the manufacturing and construction sectors combined. Almost three-quarters of these jobs are in local government. Unlike the federal government, whose nondefense spending is largely devoted to transfer payments like social security, state and local governments are direct service providers, with primary responsibility for water, sewer, and transportation infrastructure as well as important public services like education and police and fire protection. The essential nature of these services, as well as the size of the sector relative to the U.S. economy, makes stresses to the sector of particular concern.
How Did the Great Recession Affect the Sector?
Like other parts of the economy, the state and local sector typically faces difficulties when the economy slows. Tax revenues decline while costs for cyclically sensitive programs like unemployment insurance and Medicaid increase. Although states and localities can usually borrow to finance infrastructure investments, they generally have to finance operating spending—think of employee wages—with current revenues like tax collections and aid from other levels of government.
In the most recent recession, the pressures experienced by the sector were considerably greater than in past downturns. Tax receipts collected by state and local governments fell 10 percent between second-quarter 2008 and second-quarter 2009—their worst drop since at least 1948, when this data series began.
To mitigate the loss in state and local government revenue, the federal stimulus bill provided a substantial increase in federal aid, as the chart below suggests. Nevertheless, the stimulus offset only part of the effects of declining tax revenues, and total state and local revenues still dropped. Combined with the requirement to balance their operating budgets, the revenue gap forced states and localities to make difficult choices. Between fiscal years 2009 and 2011, states alone were compelled to make up more than $430 billion in budget shortfalls in order to satisfy their balanced budget requirements. Information on local government actions is harder to obtain, but it is likely that they also had to close large gaps.

As might be expected, governments seeking to close a budget gap typically exhaust easier sources of cash generation and spending cuts first, especially one-time budget savings or revenues, to balance their books. These provide short-term relief, but may in some cases add to costs in the long run. Examples of these quick fixes include drawing down rainy day funds, reducing infrastructure investment, selling assets, and skipping pension fund payments. As the recession dragged on and the recovery proved slow, these relatively low-cost measures dried up. With federal stimulus funds coming to an end and tax revenues remaining lower than before the crisis, state and local governments faced tougher budget decisions. Indeed, as the chart below indicates, the sector’s employment continued to fall even after the recession officially concluded.

The chart shows the aggregate numbers, but it may obscure the fact that these cuts affect Main Streets all over the country. For example, police layoffs have occurred in cities from Newark to San José, while 4.3 percent of teacher positions were eliminated across New York State.
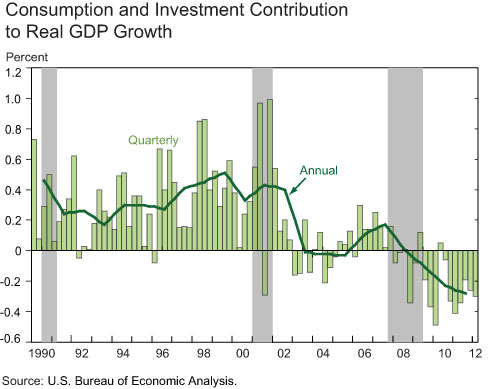
The sector’s recent weakness has also had an unusually adverse effect on GDP during the recovery. The chart below shows the sector’s contribution to real GDP growth, with quarterly figures in bars, and the line indicating the (much smoother) annual average. State and local government activity has historically contributed positively to real GDP growth, except for a brief dip following the 2001 recession. The strain on state and local government budgets has impacted the national economy more severely in this recovery than in previous years, with the sector subtracting 0.4 percent from real GDP growth in the first quarter of 2011.

What’s Ahead for State and Local Budgets?
While a growing economy and reduced spending may help support state governments in the face of declining federal aid, the outlook for local governments continues to be particularly weak. This is in large part because of their dependence on property tax revenue and intergovernmental aid, which together account for more than 70 percent of their general revenue. Since a major component of states’ budgets is aid to their local governments—education funding being a primary example—the states often balance their budgets by reducing aid to localities. Such a step can force local governments to cut their own spending, often by laying off employees. The Bureau of Labor Statistics’ May employment report showed that of the more than 150,000 state and local government jobs lost over the last year, 136,000 came from the local sector. The report also sho
wed that overall state and local employment declines continue to offset private sector growth.
In many areas, property reassessments happen only periodically, and as a result, the revenue effect of a property value decline is spread out over several years. While home values fell by about 30 percent between April 2006 and March 2008, local property tax revenues only started to decline in 2010, a trend that continued through the first half of 2012. This ongoing decline in the local revenue base, combined with lower state aid, will continue to add significant stress to localities’ budgets, darkening the outlook for the sector, particularly local government employment.
While earlier worries about massive defaults in the municipal sector were perhaps overstated, there have in fact been some high-profile defaults. In coming posts, we will discuss this market and its outlook in more detail.
Meanwhile, there has been some recovery in the state sector, but we expect that the hangover from the recession will affect both state and local governments and the economy for years to come. Some of the actions taken to address short-term funding needs can increase the severity of the long-term structural challenges that states and localities face, including underfunded pension plans and deficient infrastructure stocks. Until these challenges are successfully resolved, the state and local public sector may continue to be a drag on economic activity in the years ahead.
Disclaimer
The views expressed in this post are those of the authors and do not necessarily reflect the position of the Federal Reserve Bank of New York or the Federal Reserve System. Any errors or omissions are the responsibility of the authors.

Nora Fitzpatrick is a regional and community outreach specialist in the Federal Reserve Bank of New York’s Communications Group.

Andrew F. Haughwout is a vice president in the Office of the Directors Function of the New York Fed’s Research and Statistics Group.

Elizabeth Setren is an assistant economist in the Federal Reserve Bank of New York’s Research and Statistics Group.
 RSS Feed
 Follow Liberty Street Economics
If the public sector is going to reverse their “drag,” it will require more revenue, i.e. taxes or fees. From whence will they come? From the private sector, of course. Your city wants an additional $X million. Takes it from you. You have less freedom to determine your own future whether it is a new freezer, more savings or less debt. Whatever your city spends is only possible because of wealth transfer from its citizens. Unrestrained growth of government is a drag on GDP and eventually comes to an end. Stockton, San Jose, San Diego any one? Raising taxes or borrowing more will not solve their problems and eliminate their economic drag. We have a demographic hole in the X-Gens. There are not enough of them, even at full employment, to replicate the spending of the Boomers. The Y-Gens will be bigger than the Boomers but their peak spending years don’t occur until their children are teenagers. Census data confirms teen years happen 13 years after births. Can’t change that. Y-Gen family spending will begin surging in 2023/4. A new sustained consumer spending cycle will start. Until then, government spending will remain a real drag.
So what? Lots of sectors have had declines in the past four years. The analysis talks about GDP growth as if things were normal. They are not. The federal deficit for FY12 is estimated at 8.6% of GDP. GDP growth is reported at less than 2% in Q1-12. Subtract the deficit (without getting into the argument about whether deficits are useful) as a percent of GDP from the reported GDP growth rate and — everybody has to agree — we get a very large and unsustainable negative growth number. The economy has been contracting for several years and is only barely holding its nose above water due to the stimulus federal deficit spending. If GDP growth less the federal deficit is around -6%, then the states’ .4% GDP drag is a secondary problem, not the front-page headline story it has become. The economy as a whole needs to grow at several times the reported rate to close the growth and deficit gaps.