Jason Bram, Jonathan Hastings,* and James A. Orr
Has Wall Street—the term for the securities industry that symbolizes New York City’s role as a global financial center—become less of a specialty for the city? In this post, we show that while the securities industry continues to play an outsized role in the New York City economy, the city’s job base has become somewhat more diversified since 1990. Diversification can be beneficial, as it makes a local economy less vulnerable to adverse shocks to its key industry. A recent example appears in a post by Bram and Orr showing that with Wall Street in a bit of a slump, nonfinancial industries have picked up the slack and are leading the city’s employment recovery this time around.
It turns out that defining “diversification” isn’t as simple as it sounds. It’s a bit easier to think of the opposite—specialization—where one or a few industries account for a disproportionately large share of jobs and income. Most major cities specialize to some degree: Las Vegas in entertainment, Detroit in autos, and New York City in securities. Our strategy is to look at a few different yardsticks of specialization and draw some conclusions.
The Securities Industry’s Share of Jobs and Earnings
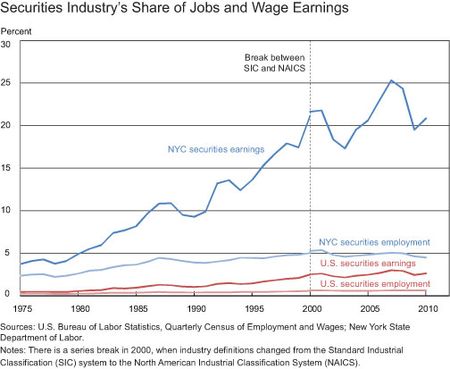
In terms of employment alone, Wall Street doesn’t seem all that dominant in the New York City economy. As the chart below shows, the roughly 165,000 workers in the securities industry today account for slightly less than 5 percent of total city employment, and the share has risen only modestly since the mid-1970s. Many industries have larger employment shares.
However, Wall Street is directly responsible for an outsized share of wage and salary earnings in the city. In 2010, the securities industry accounted for a little more than 20 percent of the earnings of all city workers—higher than any other single industry. The spending out of these above-average earnings is a key reason why each securities industry job is estimated to support two other jobs in the city (see the New York State Comptroller’s report, p. 11) and why the industry is a sizable source of city and state tax revenue. Securities industry earnings were not always as important as they are today. Indeed, in the mid-1970s the industry accounted for only 4 percent of earnings in the city—just slightly above its share of employment. It wasn’t until the early 1980s that the industry’s share of income began to take off. It reached 20 percent during the business cycle boom year of 2000 and peaked at 25 percent in 2007.
A Comparison with Other Industries
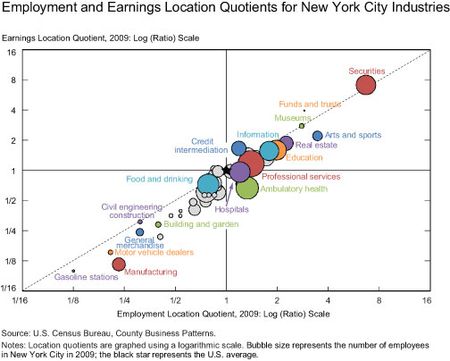
So, what can we say about the extent of specialization in the securities industry compared with other industries in the city? A common measure of an industry’s concentration or specialization is its employment location quotient (LQ)—the ratio of the industry’s share of jobs in a city to its share in the nation. An LQ greater than 1 means an industry has a higher concentration of jobs in a city relative to the national average. In 2009, the securities industry LQ for New York City was 6.7—reflecting the fact that the industry accounted for 5.4 percent of private sector jobs locally versus 0.8 percent nationally (6.7=5.4/0.8). One can also calculate a location quotient based on share of income; that would generate an even higher number for the securities industry.
How does the securities industry compare with other industries? In the chart below, we plot the city’s industries on a grid with employment and payroll LQs on the horizontal and vertical axes, respectively. An industry with the U.S. average share of jobs and payroll would be found dead center, where the star is. The size of each industry’s bubble reflects the number of employees in New York City.
The securities industry—both large and far off in the northeast quadrant—stands out as New York City’s key specialty. You’ll recall that its share of local employment is 6.7 times as high as the nation’s, while its income share is 7.1 times higher. Yet the city also specializes in a number of other industries, such as real estate, education, information, and museums. By contrast, the city doesn’t specialize in manufacturing, whose employment and especially payroll shares are far below the national average.
Diversity versus Specialization over Time
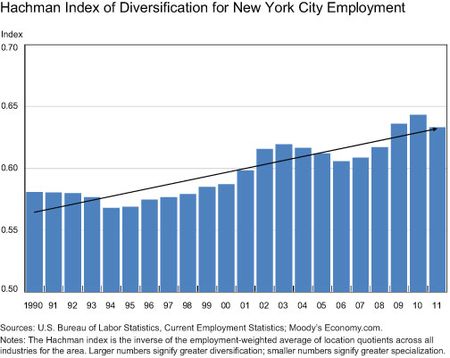
Now let’s look at how New York City’s specialization has changed over time relative to the national economy. For that, we use the Hachman index—a single measure that summarizes how a local area’s industrial mix compares with the national mix. A Hachman index of 1.0 indicates that a local industry mix is identical to that of the United States as a whole. Readings closer to 0 indicate extreme specialization. (See the article “Economic Diversity and New York State” for more detail and comparisons between New York and other states.)
The Hachman index for jobs, as shown in the chart below, suggests that since the mid-1990s, New York City’s economy has become somewhat more diversified. Part of this shift reflects trends in the city’s key financial activities sector, whose share of citywide employment fell from 14 percent in 1995 to under 12 percent in 2011; similarly, the securities industry’s share of employment declined from 4.8 percent to 4.5 percent in the city, while its nationwide share rose from 0.5 percent to 0.6 percent. Increased diversification also resulted from some less-represented sectors gaining ground in the city over time, including retail trade and eating and drinking establishments. Thus, while still quite different, the industrial mixes for New York City and the nation now look a bit more similar than they did in the early 1990s. Of course, over this period our baseline measure—the nation’s industry mix—has evolved as well: Sectors like health and education and professional and business services have grown in importance, while manufacturing and wholesale and retail trade have waned.
Good News?
Is New York City’s rising job diversification good news? The answer isn’t simple. Trade theory suggests that regions benefit from specializing in certain industries and trading with localities that specialize in other activities.
Yet there are advantages to diversification. Diversified economies bear less risk from adverse shocks to their hometown industries and therefore may be less volatile and more cushioned against steep job losses during a recession, resulting in greater protection for their workers and the health of their state and local governments. They also face less risk that at some point a key industry may enter into long-term decline.
The literature and evidence on the advantages and disadvantages of specialization are mixed and inconclusive. (For more in-depth reading on this subject, see Duranton and Puga [1999].)
What it boils down to is that some specialization can be beneficial. This is particularly true if a region specializes in growing industries that pay well. While Wall Street certainly fits that description, New York City also benefits from specialization in a variety of other industries.
* Jonathan Hastings is a financial/economic analyst in the Research and Statistics Group.
Disclaimer
The views expressed in this post are those of the authors and do not necessarily reflect the position of the Federal Reserve Bank of New York or the Federal Reserve System. Any errors or omissions are the responsibility of the authors.


 RSS Feed
 Follow Liberty Street Economics