Michele Braun, Adam Copeland, Alexa Herlach, and Radhika Mithal
Transactions denominated in U.S. dollars flow around the clock and around the globe, filling the pipelines that support commerce. On a typical day, more than $14 trillion of dollar-denominated payments is routed through the banking system. Critical to a well-functioning economy are the timing and smooth flow of dollars for large-value transactions and the infrastructure that enables that dollar flow. This financial market infrastructure provides essential economic services—“plumbing” for the economy—and is made up of a variety of entities. In this post, we describe this financial market infrastructure, providing a simple map of its main entities and describing the flow of U.S. dollar payments among these entities. A more detailed study of intraday liquidity flows has been released by the Payments Risk Committee.
Overview of the U.S. Dollar Clearing and Settlement Network
All noncash transactions—whether payments for goods and services or payments to support financial contracts (such as the buying and selling of securities or execution of foreign exchange transactions)—need to be routed through the banking system and settled in order to be complete and final. Banks and specialized financial market utilities (FMUs) provide these services, which include large-value transfers, government securities clearing, foreign exchange (FX) settlements, central counterparty (CCP) services, central securities depositories, and electronic retail settlements. U.S. dollar transactions support a full range of reasons for moving cash: payments to settle business obligations among banks’ customers, payments to or from individuals, relocation of funds among entities, and settlement of banks’ own investments, to name a few.
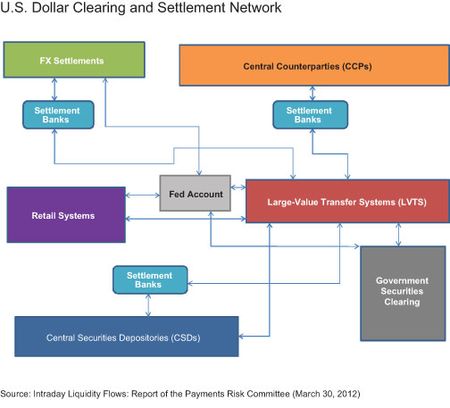
The various financial transactions occur within and between banks and FMUs. Transfer of value occurs when balances are moved between entities that both have accounts with the same bank, and the transactions are settled when the transfer is complete. The Federal Reserve Banks provide this service for U.S. depository financial institutions, settlement banks provide a similar service for their bank and FMU customers, and clearing banks do so for government securities dealers. The chart below shows a stylized view of the U.S. dollar payments, clearing, and settlement system. This illustration highlights the various types of entities connected by lines that show general flows of funds and securities. The boxes represent the types of FMUs that transfer or settle U.S. dollar value. The lines illustrate the dollar flows and resulting interconnections among the entities.
Payment Transactions versus Funding Transactions versus Funding Flows
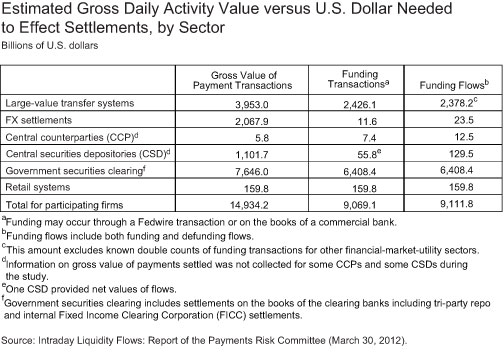
The table below compares the aggregate values of transactions settled within the participating FMUs and clearing banks, the cash needed to effect these settlements, and the supporting amounts of funds that need to flow to and from each entity. We refer to these as payment transactions, funding transactions, and funding flows, respectively, corresponding to the table’s columns from left to right. The following example illustrates how the respective values would be calculated: A CCP generally requires participants that owe money to the CCP (a “net debit” position) to send those monies to the CCP (in a simple example, $10 billion). After the monies are received, the CCP pays out an equal amount of value to participants ending the settlement period in a “net credit” position (also $10 billion). In this example, the payment transaction amount would be $10 billion, the funding transaction would be $10 billion, and funding flows would be $20 billion ($10 billion transferred from the net debit participants to the CCP and the $10 billion transferred from the CCP to the net credit participants).
Because the designs of FMUs differ, the relationships among these three values vary considerably. Some FMUs offer internal processes specifically designed to conserve liquidity. Some FMUs (such as Fedwire Funds and Fedwire Securities) connect other FMUs and banks in real time and with immediate finality. And other FMUs (for example, retail settlement systems) use batch settlement processes that debit and credit transfers of equal value among the bank accounts of payors and payees. Depending on their designs, FMUs can conserve cash liquidity and provide other efficiencies by standardizing rules, managing risks, and offsetting transactions many times their gross settlement values. One approach is not better than any other; they are just different.
Aggregate Hourly Activity
The table above describes payment transactions, funding transactions, and funds flows, summed to daily aggregates. In practice, funds flow and transactions settle throughout the day. Once a transaction is final, the recipient can use the money received to fund a later transaction. Most of the monies that are “recycled” are transferred either through large-value transfers or on the books of a settlement or clearing bank.
The hours during which the entities that participated in this study settle payments, as well as the peaks and valleys of those flows, vary consider
ably—as do these entities’ active settlement hours. Some systems operate virtually twenty-four hours a day, and others for only short windows of time. Real-time or multi-batch flow systems are active for more hours than batch systems that settle transactions once or twice a day. This does not, however, imply that they settle relatively more or less value.
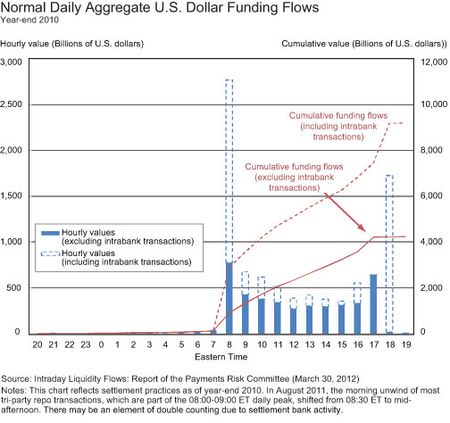
The chart below shows consolidated hourly values of U.S. dollar funding flows for the entities that participated in the PRC study. The overall pattern is bimodal, with relative peaks at the beginning and end of primary eastern U.S. business hours. Before 08:00 ET, the aggregate value of payment flows is fairly low and primarily reflects activity in offshore and cross-border systems. As the day progresses, funds values increase: at about 08:00 ET, a number U.S. domestic entities open for business, and domestic payments and settlement of government securities pick up. Aggregate flows flatten out somewhat midday and then increase in the late afternoon as the end of the regular business day approaches. Activity falls off after 18:00 ET as most U.S. markets and systems close, and once again the remaining activity is related to overseas systems.
In this chart, the solid blue bars represent funding flows between entities, and the dashed sections show the specialized government securities clearing business within banks. The red lines show cumulative flows over the day.
Conclusion
More than $14 trillion in dollar-denominated payments is routed through the U.S. banking system each day. Understanding the infrastructure that supports these payments—now described in this post and the Payments Risk Committee’s study—is important for policymakers and system participants alike. In particular, both need to be cognizant of how regulation, economic conditions, and market practices may impact the flow of U.S. dollar payments among the entities described above. Going forward, it is important to continue to monitor the network of entities that enables the flow of U.S. dollar payments to ensure that payments are transferred and transactions are settled in an efficient manner. In addition, updating this study periodically will provide important information about the sufficiency of dollar liquidity intraday to settle these payments.
Disclaimer
The views expressed in this post are those of the authors and do not necessarily reflect the position of the Federal Reserve Bank of New York or the Federal Reserve System. Any errors or omissions are the responsibility of the authors.

Michele Braun is an officer in the Payments Policy Function of the New York Fed’s Credit and Payments Risk Group.

Adam Copeland is a senior economist in the Money and Payments Studies Function of the New York Fed’s Research and Statistics Group.

Alexa Herlach is a financial/economic analyst in the Payments Policy Function of the New York Fed’s Credit and Payments Risk Group.

Radhika Mithal is a senior associate in the Market Operations, Monitoring, and Analysis Function of the New York Fed’s Markets Group.


 RSS Feed
 Follow Liberty Street Economics
Since 2008 banks have acquired large quantities of excess reserves on their balance sheets. Does this have any impact whatsoever on daily liquidity management, or are any additional assets extraneous?
If $14 trillion in dollar-denominated payments is routed through the U.S. banking system each day. I think understanding the infrastructure that supports these payments is important for policymakers and system participants.
If the banking system as a whole becomes short foreign exchange (similar to how it sometimes goes short of reserves until the Fed intervenes), how does the central bank provide the necessary foreign exchange to the banking system?
I think all noncash transactions need to be routed through the banking system and settled in order to be complete and final. U.S. dollar transactions support a full range of reasons for moving cash: payments to settle business obligations among banks’ customers, payments to or from individuals, relocation of funds among entities…