Richard K. Crump and David O. Lucca
Many economic time series display periodic and predictable patterns within each calendar year, generally referred to as seasonal effects. For example, retail sales tend to be higher in December than in other months. These patterns are well-known to economists, who apply statistical filters to remove seasonal effects so that the resulting series are more easily comparable across months. Because policy decisions are based on seasonally adjusted series, we wouldn’t expect the decisions to exhibit any seasonal behavior. Yet, in this post we find that the Federal Reserve has been much more likely to lower interest rates in the first month of each quarter over the past twenty-five years. While some of this seasonality is a result of meeting scheduling, a large seasonal component remains unexplained.
Monetary policy decisions in the United States are made by the Federal Open Market Committee (FOMC), the Fed’s monetary policymaking body. The FOMC makes policy decisions—setting the target for the federal funds rate and, since fall 2008, announcing large-scale asset purchases of Treasury and agency securities—at its meetings. The meetings generally occur eight times per year (or about once every six weeks), although only four meetings per year are required by law. The FOMC has also met at other times, in unscheduled meetings, but only relatively infrequently.
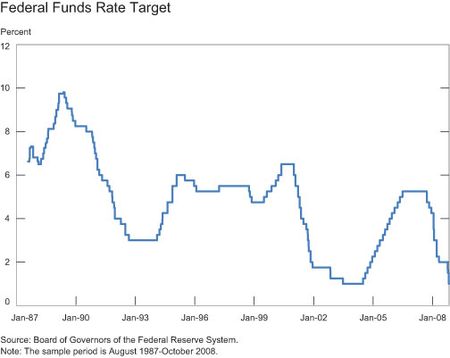
The sample period of our seasonal analysis begins in August 1987, the start of Chairman Greenspan’s tenure, and ends in October 2008, when the last FOMC meeting occurred before the announcement of large-scale asset purchases on November 25, 2008. Over this period, the target for the federal funds rate was the main policy instrument used by the Fed, and the rate trended lower, as shown in the chart below.
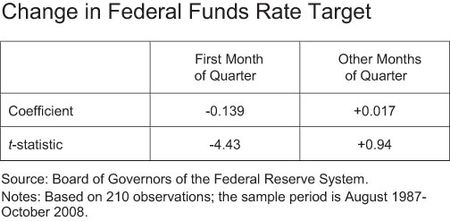
In particular, the target rate has declined on average about 2 basis points per FOMC meeting over the sample period. However, the change in the rate has displayed a stark seasonal pattern. The table below shows the difference between the mean percentage point change in the federal funds rate target for FOMC meetings in the first month of the quarter (January, April, July, and October) compared with the remaining eight months of the year.
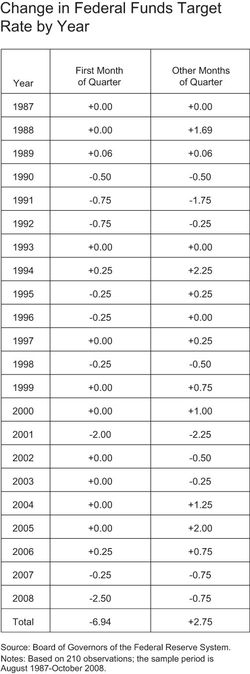
We see that the target for the federal funds rate declined on average about 14 basis points in the first month of each quarter. In the remaining eight months, the target rate rose about 2 basis points over our sample. The difference isn’t only economically significant, but also highly statistically significant. Based on the estimated standard errors, there’s a 95 percent probability that the decline lies between 20 and 7 basis points. The next table lists by year the total change in the target federal funds rate in the first month of the quarter compared with the remaining months.
Over our sample period, the FOMC has hardly ever raised the target rate in total over the first month of each quarter. The exceptions are 1989, 1994, and 2006; however, in 1994 and 2006, there was still a disproportionate degree of tightening that occurred in the other eight months. In fact, in 1994 the target rate was increased only 25 basis points in the first month of each quarter; this figure is dwarfed by a rise of 225 basis points that occurred in the other eight months. A similar pattern emerges in 2004 and 2005, when the target rate was unchanged in the first month of each quarter but raised 125 and 200 basis points, respectively, in the remaining eight months of the year. Finally, the table also provides the total change in the target rate in each category. The rate has been reduced about 700 basis points in the first month of each quarter compared with an increase of 275 basis points in the remaining months.
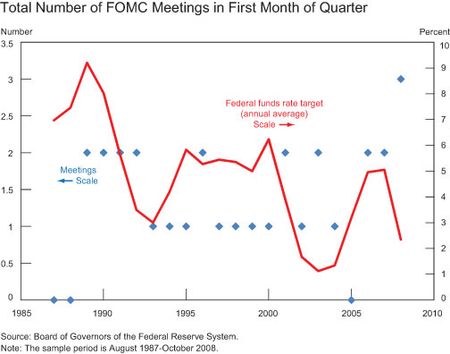
Why do we observe this seasonal pattern? It appears that a partial, but incomplete, explanation for these surprising results is the schedule of FOMC meeting dates. As the chart below shows, there tend to be more FOMC meetings in the first month of each quarter in periods when the target federal funds rate has been falling, whereas there have been fewer meetings in the first month of each quarter in periods when the rate has been rising.
For example, as rates increased in late 1987, 1988, and 2005, no meetings were scheduled in the first month of the quarter. At the other extreme, when rates declined sharply in 2008, three meetings were scheduled in the first month of each quarter—the only time that’s happened over our sample period.
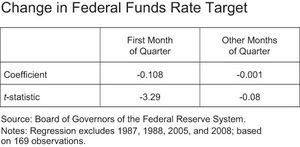
We can now revisit our initial results to see what happens after removing years in which there were particularly few or many FOMC meetings scheduled in the first month of the quarter.
As the next table shows, removing these years does reduce the statistical significance and economic magnitude of the seasonal effect somewhat; however, it doesn’t eliminate it. In terms of economic magnitude, for example, the target for the federal funds rate now declines about 11 basis points in the first month of the quarter compared with the 14 basis point decline we found when we included all years in the sample.
In conclusion, while we can explain about a fifth of the federal funds target rate differential in the first month of each quarter, most of the pattern remains unaccounted for. The underlying reason for this result is a topic for further study.
Disclaimer
The views expressed in this post are those of the authors and do not necessarily reflect the position of the Federal Reserve Bank of New York or the Federal Reserve System
. Any errors or omissions are the responsibility of the authors.

Richard K. Crump is a senior economist in the Research and Statistics Group of the Federal Reserve Bank of New York.

David O. Lucca is an economist in the Research and Statistics Group of the Federal Reserve Bank of New York.


 RSS Feed
 Follow Liberty Street Economics