Stavros Peristiani
The high valuations achieved by recent social-media- and Internet-related initial public offerings (IPOs) and their disappointing aftermarket performance have rekindled the specter of the dot-com boom and bust of the late 1990s. This post extends the analysis of my 2004 Current Issues article (with Gijoon Hong) that documents a gradual but significant deterioration in the quality of issuing companies since the 1980s, a trend that reached a low point with the bursting
of the Internet bubble in 2000. Despite considerable investor interest in
recent web startups, the volume of IPO proceeds has remained weak since the
2000 Internet collapse. An important lesson of the boom-and-bust episode is
that a viable and well-functioning IPO market must be based on companies with
sound fundamentals and business plans. Although there are no signs of another
tech bubble, my post shows that IPO companies have remained, on average, weak
financially over the 2001-11 period.
IPO Issuance Since 2000
IPO activity in the United States has fluctuated over the past three decades, influenced by the strength of the economy, technological and financial innovations, and other company- and industry-specific factors. The number and nominal volume of IPO proceeds surged in the 1990s, especially during the Internet boom period between 1995 and 2000, but plummeted after the collapse of the high-tech bubble in 2000 (see chart below).
Another way to measure the drop-off in IPO activity is relative to the total stock market capitalization in the United States (see chart below). Historically, the IPO market has rebounded from adversity, recovering after recessions in the early 1980s and 1990s. However, the number of priced offerings and volume of proceeds have remained very low throughout the 2000s.
Researchers have offered several explanations for the reluctance of private companies to sell shares to the public in the United States: a stricter regulatory environment (owing to the Sarbanes-Oxley Act of 2002 and the Securities and Exchange Commission’s Fair Disclosure rules), greater threat of litigation by investors, the loss of confidence resulting from the disastrous Internet bubble experience, decimalization reforms, stronger competition from overseas stock markets, and declining analyst coverage.
Deteriorating Quality
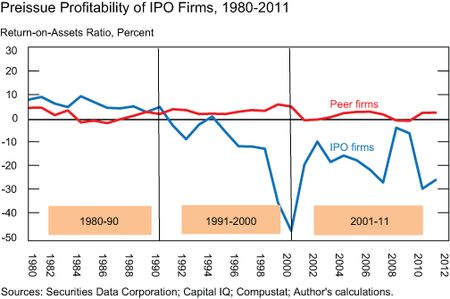
It’s widely acknowledged that a key reason for the Internet debacle was the deteriorating quality of businesses that decided to go public. To analyze the financial strength of IPO companies, I compare their profitability (measured by the return-on-assets ratio) with a cohort of nonissuing firms over the past three decades. IPO firms were, on average, more profitable than their nonissuing peers during the 1980s. However, as the chart below shows, there was a noticeable deterioration in the profitability of offering firms during the 1990s and 2000s, while the cohort of non-IPO firms remained profitable.
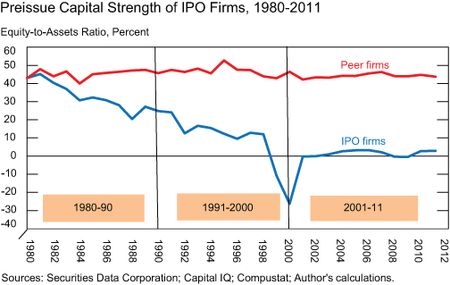
Another important indicator of financial soundness is capital adequacy (or equity measured by total assets minus total liabilities). The chart below shows the average
equity-to-assets ratio of issuers and their nonissuing peers from 1980 to
2011. IPO companies exhibit a dramatic deterioration in their preissue capitalization relative to their peers. The widening gap in net worth between issuing companies and their peers is discernible as far back as the early 1980s and continues to this year.
IPO firms continued to underperform their peers from 2001 to 2011. (One explanation for the weakened financial condition of IPO issuers over this period is the strategic decision of profitable private firms to merge with public firms in a similar industry that can introduce their products to the market more quickly. See Gao-Ritter-Zhu
2012).
The continued underperformance of IPO companies serves as a warning sign to investors. My 2004 Current Issues article shows that, when other factors are held constant, investors who bet on more speculative, unprofitable IPO firms from 1980 to 2000 faced roughly three times the risk of losing their money than those who invested in profitable firms.
A Threatened Growth Outlook?
Although IPO flows represent a relatively small share of total stock market capitalization, they’re a vital source of organic growth for equity markets. As such, newly listed companies have to be financially strong and possess the capacity to develop and flourish. As this post suggests, the relatively few
IPOs that occurred between 2001 and 2011, many of which had lackluster
fundamentals, could be the harbinger of a more challenging growth outlook for
U.S. equity markets.
Disclaimer
The views expressed in this post are those of the authors and do not necessarily reflect the position of the Federal Reserve Bank of New York or the Federal Reserve System. Any errors or omissions are the responsibility of the authors.
Stavros Peristiani is an assistant vice president in the
Federal Reserve Bank of New York’s Research and Statistics Group.


 RSS Feed
 Follow Liberty Street Economics