Mary Amiti and Mark Choi
U.S. import prices of consumer goods shipped from China have been moderating in recent quarters, following an upward surge of 11 percent between mid-2010 and the end of 2011. These price changes have far-reaching consequences for U.S. businesses and consumers, because China is the largest single supplier of imports to the United States, accounting for more than 20 percent of nonoil imports and more than 30 percent of consumer goods. In this post, we track U.S. import price movements in different product categories from China by constructing import price indexes that use highly disaggregated data. We also explore various underlying factors that might explain these important trends.
Measuring Import Prices
To identify trends in import prices of consumer goods from China, we construct our own price index, because official statistical agencies only provide aggregate price indexes. Each month, the U.S. Bureau of Labor Statistics (BLS) publishes an aggregate U.S. import price index that averages movements across all source countries. The aggregate index in turn is divided into separate indexes by type of goods imported, referred to as end-use categories, that include industrial supplies, consumer goods, capital goods, and autos. In addition, the BLS computes a separate price index for some source countries, including China. These country-specific indexes, however, are not broken out by end-use categories.
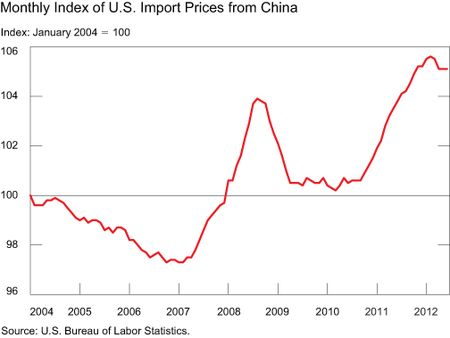
The BLS began publishing its index of Chinese import prices relatively recently, in December 2003 (see chart below). Since its introduction, the index has depicted two periods of rising import prices—the first one in 2007-08 and the second beginning in mid-2010. More recently, the index is showing a decline.
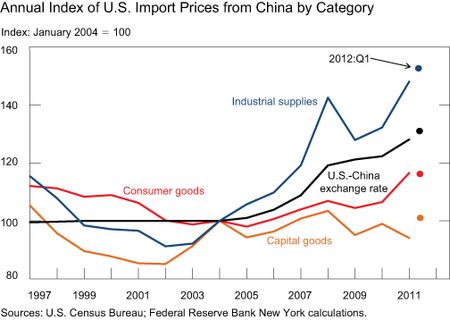
To explore the forces behind these price increases, we construct indexes that track import prices from China for a longer time period, back to 1997, and decompose the indexes by product type. Because individual prices for all of these imports are unavailable, we use unit-value data—the ratio of import values to quantities—as a proxy for import prices (our 2009 Current Issues article describes our methodology).
The next chart, which depicts our unit-value indexes by end-use category using average annual data, reveals a number of interesting patterns that aren’t visible in the aggregate data. First, between 1997 and 2005, when the renminbi (RMB) was pegged to the U.S. dollar, prices in all major categories of imports from China were on a downward trend. Second, between 2005 and 2009, higher import prices of Chinese goods were mainly driven by jumps in industrial supply prices—goods whose prices are driven by raw-material costs. Over this four-year period, consumer prices increased only 7 percent, even though the nominal RMB appreciated 20 percent against the dollar.
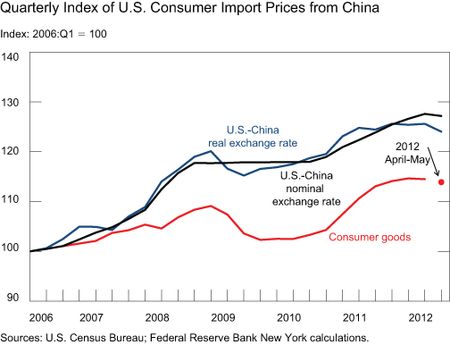
Third, in mid-2010, when the RMB started to appreciate again, import prices of consumer goods rose by 11 percent between 2010:Q2 and 2011:Q4, a period in which the nominal RMB appreciated 7 percent against the dollar and the CPI-adjusted real RMB appreciated by 11 percent. This is easier to see in the chart below, which uses quarterly data and which we were able to construct only for a shorter period. The chart plots the quarterly unit-value index for consumer goods, the nominal U.S.-RMB exchange rate, and the CPI-adjusted real RMB-dollar exchange rate. Fourth, in 2012, the first two quarters of data indicate a decline in consumer goods prices, with a flattening of the nominal exchange rate and a decline in the real exchange rate.
What’s behind the Turnaround in Consumer Goods Prices from China?
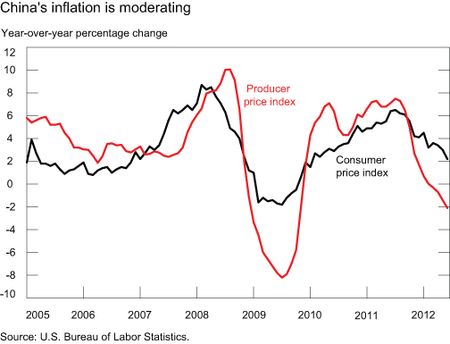
A number of factors could help explain the recent turnaround in the import prices of consumer goods from China. One, the RMB has been flat or declining against the U.S. dollar in the last two quarters, both in nominal terms and in CPI-adjusted real terms. Two, inflationary pressures, as seen in the chart below showing the PPI and CPI, have been moderating. This lower Chinese inflation reflects both demand and supply factors. China’s domestic property sector correction has reduced housing prices and contributed to the decline in global commodity prices. Meanwhile, weakening external demand has moderated factory-gate prices in China’s manufacturing sector while food prices have cooled this year due to favorable supply conditions. Three, while employment and wage data are patchy, the available data and anecdotal evidence suggest that some wage and employment growth may be softening a bit from the very rapid pace set in the immediate post-recovery period, as the Chinese economy has continued a protracted slowdown.
Can We Continue to Expect Lower Import Prices from China?
Whether recent moderation in the growth of U.S. consumer goods prices from China continues will depend on a number of cyclical and structural factors. One such factor is whether the slowdown in RMB appreciation against the dollar over the past year will continue; markets are not pricing in significant appreciation expectations over the coming year. Analysts have pointed to several factors behind the slowdown in RMB appreciation, including a reduction in China’s current account surplus and weaker net private financial inflows. The International Monetary Fund now considers the RMB to be “moderately undervalued” instead of “significantly undervalued.” Over the longer term, the future of Chinese wage and productivity growth, the continued development of China’s domestic market, and the ability of Chinese firms to move up the value-added ladder will also influence the direction of U.S. consumer goods prices from China.
While it’s difficult to assess the precise impact of changes in import prices on U.S. inflation, there are a number of channels we can identify. First, imported consumer goods contribute directly to U.S. CPI. Second, imported goods also enter into the production of domestic goods, as some of these are intermediate inputs, which contribute directly to U.S. producers’ costs and thus to the prices of domestic goods. Third, import prices of Chinese goods influence the prices of competitors, which include other exporters to the United States and domestic producers.
Conclusion
Since mid-2010, we saw upward pressure on consumer goods prices from China. This coincides with the RMB’s appreciation against the U.S. dollar, increased pressure on wages, and inflation in China. However, at the beginning of 2012, we started to see consumer import prices from China fall, and this coincided with a period of real RMB depreciation against the dollar, lower inflation, and perhaps less pressure on Chinese wages. Going forward, there are signs that consumer goods prices may continue to stagnate in the near term, given market expectations of less RMB appreciation and lower inflation.
Disclaimer
The views expressed in this post are those of the authors and do not necessarily reflect the position of the Federal Reserve Bank of New York or the Federal Reserve System. Any errors or omissions are the responsibility of the authors.

Mary Amiti is an assistant vice president in the Federal Reserve Bank of New York’s Research and Statistics Group.

Mark Choi is a senior economic analyst in the Bank’s Emerging Markets and International Affairs Group.


 RSS Feed
 Follow Liberty Street Economics