Stefania Albanesi, Victoria Gregory, Christina Patterson, and Ayşegül Şahin
More than three years after the end of the Great Recession, the labor market still remains weak, with the unemployment rate at 7.7 percent and payroll employment 3 million less than its pre-recession level. One possibility is that this weakness is a reflection of ongoing trends in the labor market that were exacerbated during the recession. Since the 1980s, employment has become increasingly concentrated among the highest- and lowest-skilled jobs in the occupational distribution, due to the disappearance of jobs focused on routine tasks. This phenomenon is called job polarization (see Autor et al. [2003], Acemoglu and Autor [2010], Jaimovic and Siu [2011], and Abel and Deitz [2011]).
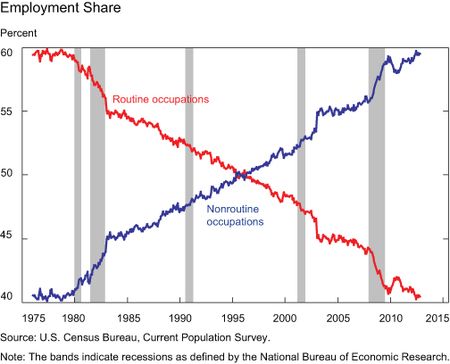
To study job polarization, it’s useful to put occupations into different task groups, with each occupation categorized as either routine or nonroutine. An occupation is routine if its main tasks require following explicit instructions and obeying well-defined rules. These tend to be middle-skilled jobs. If the job involves flexibility, problem solving, or creativity, it’s considered nonroutine. Job polarization occurs when employment moves to nonroutine occupations, a category that contains the highest- and lowest-skilled jobs. The chart below shows the employment share of routine and nonroutine jobs in the United States starting from 1976. The share of routine occupations declined from 60 percent in 1976 to 40 percent in 2012, resulting in job polarization.
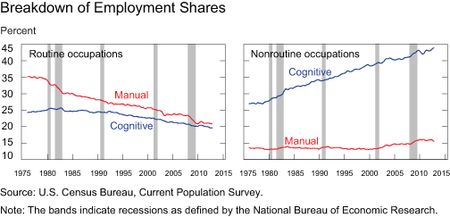
It’s useful to further classify occupations into cognitive and manual categories based on the amount of mental or physical activity required of the job: cognitive jobs require mostly mental activity; manual jobs, mostly physical.
For instance, nonroutine cognitive jobs are generally high-skilled and include management, technical, and healthcare workers, such as doctors and engineers. Manual nonroutine occupations are generally low-skilled and include service and protection workers, such as waiters and security guards. Cognitive-routine jobs include sales and office workers, such as sales agents and office assistants. Manual routine occupations include construction workers, mechanics, and machine assemblers.
As the chart below shows, the share of routine jobs has been steadily decreasing for the cognitive and manual categories since the 1980s, and the decline accelerated during the 1981-82 and 2007-09 recessions. Most of the rise in the employment share of nonroutine jobs reflects the increase in cognitive nonroutine occupations.
The rise in job polarization during the most recent labor market slowdown can potentially account for why the labor market recovery has been sluggish. In particular, it can explain the persistently high unemployment rate and the rise in long-term unemployment. If this is the case, we should see weakness in the segments of the labor market that involve routine jobs. We examine this idea by looking at different labor market indicators for different occupation groups in the current labor market downturn. (See interactive charts for indicators for workers from different occupations at a more disaggregated level.) Foote and Ryan (2012) provide a detailed analysis of all recessions starting from 1976. Their results suggest that most of our findings for the recent downturn also apply to the earlier recessions.
Unemployment
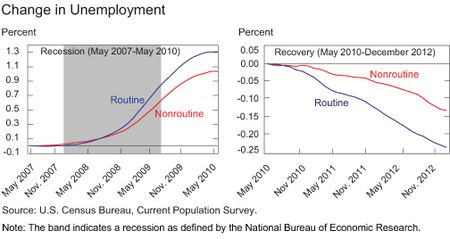
The following chart displays the percentage change in the unemployment rate for routine and nonroutine occupations during the most recent slowdown. We start from the trough of the aggregate unemployment rate in May 2007, and examine a recession and a recovery window. Between May 2007 and May 2010, the unemployment rate for routine occupations rises by 130 percent, while it rises by 103 percent for nonroutine occupations. However, this behavior is matched by a more sizable and rapid decline in the unemployment rate for routine occupations relative to nonroutine in the recovery. This suggests that the larger increase in the unemployment rate for routine occupations during the recession reflects mostly cyclical factors. For example, construction and manufacturing sectors, which typically include routine jobs, had substantial employment declines during the recession. If job polarization were responsible for the sluggish recovery, we’d expect the unemployment rate among routine jobs to fall more slowly than the rate among nonroutine jobs. The chart shows that this isn’t the case.
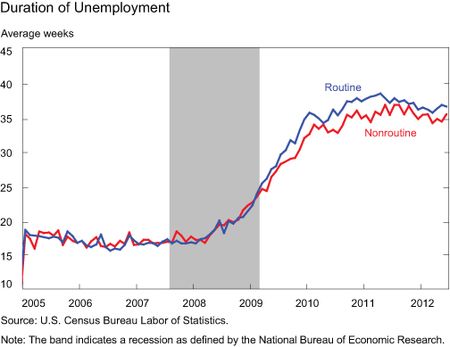
Long-term unemployment. If job polarization is causing long-term unemployment, we should expect long jobless spells to be more common among workers with routine occupations. We see from the next chart that this isn’t supported by the data—the duration of unemployment spells increased significantly during the recession for all occupation groups, and has remained high for all groups. This suggests that the job-finding prospects of the unemployed in routine occupations aren’t any worse than prospects for those in nonroutine occupations.
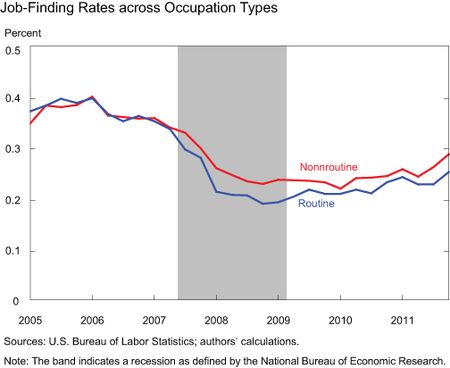
Job-finding rates. The main reason why the unemployment rate has been persistently high is the slow recovery of the rate at which unemployed workers find jobs. Job polarization can potentially explain this phenomenon if workers displaced from routine jobs have more difficulty finding employment than those displaced from nonroutine jobs. However, the chart below shows that this isn’t the case, and that all job-finding rates are recovering similarly.
Occupational Transitions
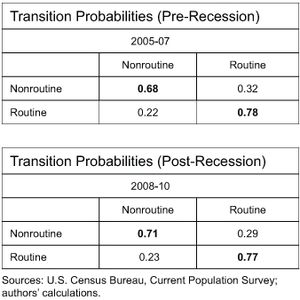
If job polarization is depressing the prospects of the unemployed, we should see more occupational transitions from routine to nonroutine jobs after the recession. If people were unable to find routine jobs, they’d be incentivized to retrain and search for work in nonroutine occupations. The table below shows that this isn’t the case—in both the pre-recession and recession periods, only 22 percent and 23 percent, respectively, of unemployed workers moved from routine to nonroutine jobs. This means that three-quarters of unemployed workers in routine occupations who found jobs remained in routine occupations.
Our findings show that while job polarization is an important ongoing trend in the labor market, it’s not a key contributor to the sluggish labor market recovery. Our analysis suggests that the weakness in the labor market is broad based and not limited to a certain segment of the market.
The unemployment rates, average duration of unemployment, and the job-finding rates for workers from different occupations can be analyzed in these interactive charts.
Disclaimer
The views expressed in this post are those of the authors and do not necessarily reflect the position of the Federal Reserve Bank of New York or the Federal Reserve System. Any errors or omissions are the responsibility of the authors.
 Stefania Albanesi is a senior economist in the New York Fed’s Research and Statistics Group.
Victoria Gregory is a senior research analyst in the Research and Statistics Group.
Christina Patterson is a senior research analyst in the Group.



 RSS Feed
 Follow Liberty Street Economics
While I agree with a lot of this you are missing a lot. Many of us taught ourselves how to program computers after our military service simply because college courses did not exist back in the late 70’s for what we were doing with these tools. During the next 30 plus years we either built, or supported much of the infrastructure that runs our business community. Yet these days we can’t buy a interview even though our skills are as strong as ever
To the authors, How did you conclude that job polarization isn’t a key contributor to labor market recovery? The first three charts seem to indicate that there is a labor market shift towards more cognitive non routine jobs or the jobs that provide services to those same people. Regarding occupational transitions, the job-finding rates further support the claim of job polarization being a key contributor. “If people were unable to find routine jobs, they’d be incentivized to retrain and search for work in nonroutine occupations.” – People look for jobs utilizing the skill they already have, very few have the resources to retrain. Probably fewer have the necessary educational background and financial capability to quickly gain new skills. I don’t think this article did a good job of disproving job polarization as a key contributor. The numbers used are lacking vital demographic data to support your claims.