Anna Kovner, Phoebe White, and Lily Zhou
In this post, we offer comparisons between banks with and without publicly traded equity. Our post uses the link produced by the New York Fed containing regulatory identification numbers (RSSD ID) from the National Information Center (NIC) to the permanent company number (PERMCO) used by the Center for Research in Security Prices (CRSP). The list available via the data link allows researchers to match regulatory information on U.S. bank holding companies (BHCs) with equity market information, including security prices. The link can be used to assist academic papers that conduct event studies on banks (recent papers using these data include Baker and Wurgler [2013] and Ettredge et al. [2013]).
What Exactly Is this Link?
The RSSD ID is a unique identifier assigned to commercial banks or BHCs by the Federal Reserve; it’s the primary identifier of entities in regulatory reports, such as the call report (FFIEC031) and the FR Y9-C form. The PERMCO is a unique and permanent company identification number assigned to publicly traded institutions in the CRSP database. While a company may change its name, ticker, exchange, or CUSIP, the PERMCO remains the same. Linking the RSSD ID to PERMCO allows researchers to match bank regulatory data with financial market data.
How Does the New York Fed Assemble these Linked Data?
After academics expressed interest in the data, the New York Fed first posted the link in 2007, based on internal data sets. The matching methodology until 2007:Q4 was based on a hand-match of all banks in the December volume of the SNL Bank Quarterly for 1990-2006. The Bank Quarterly contained geographic and financial data for publicly traded banks and BHCs on a quarterly basis. It provided market data on banks traded on the NYSE, AMEX, and NASDAQ, as well as on entities traded on the OTC Bulletin Board and Pink Sheets beginning in 2001.
After the Bank Quarterly was discontinued in 2006, researchers developed a new methodology to match banks’ RSSD IDs to PERMCOs based on name, city, and state, as well as balance sheet variables. This algorithm is repeated each year, and matches are confirmed by hand. Detailed information on the matching algorithm is available via the data link.
Tricks of the Trade
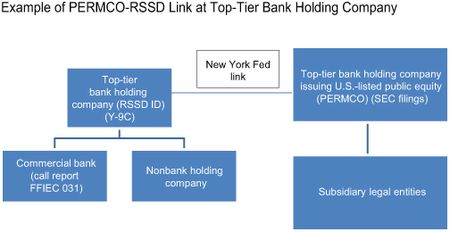
Researchers new to these linked data often try to look for public equity information on commercial banks. However, the data set only links BHCs (or commercial banks without parent bank holding companies) to the CRSP database. This means that we link the parent entity to the CRSP identifier. For example, as shown in the diagram, a large BHC like Citigroup has six commercial bank subsidiaries that file separately. We don’t link the six commercial banks, only the parent BHC, since that entity is the closest match to the company traded on the public market. Commercial banks can be linked to their parent BHC on the NIC website.
Public and Private Banks
The link can also be used to compare banks with public equity and those with private equity. In this post, we look at the larger BHCs that file Y-9C forms. Of the 1,131 that filed the 2012:Q3 Y-9C and are headquartered in the United States, approximately one-third have publicly traded equity. We compared 398 public banks matched in this link with 733 private banks.
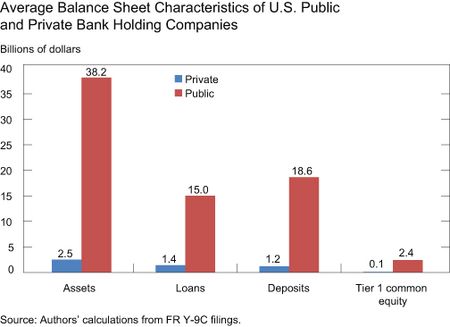
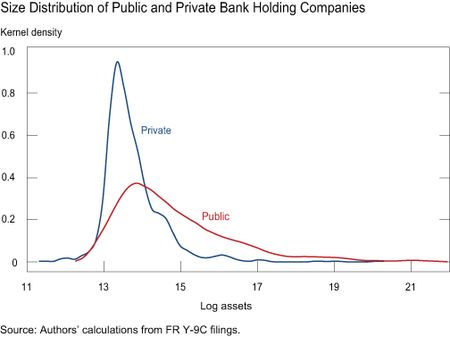
As shown in the following charts, while there are fewer public banks, they’re dramatically larger than the private institutions in aggregate, although this mostly reflects the huge size of the biggest public banks.
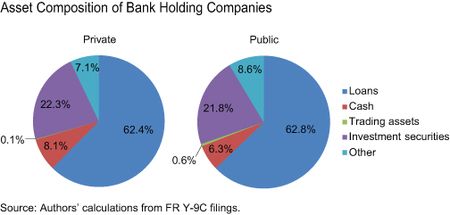
The average asset composition of public and private banks is remarkably similar. On average, public banks have a greater percentage of assets that are trading assets and they maintain less cash. The slightly higher percentage of trading assets reflects a large amount of such assets held by the largest banks, while smaller, publicly traded banks have amounts of trading assets similar to those of comparably sized private banks.
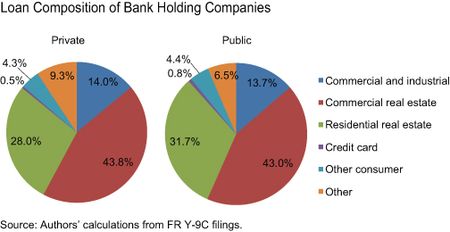
Looking closer at the loan book of public and private banks, we note that public banks hold more residential real estate loans.
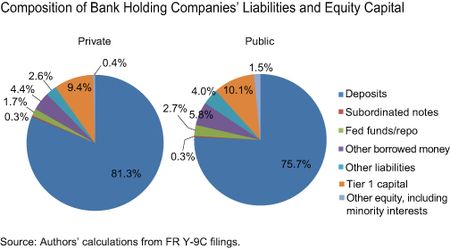
From a liability perspective, on average, public banks have similar amounts of Tier 1 capital as a percentage of assets, and deposits are a lower percentage of their liabilities.
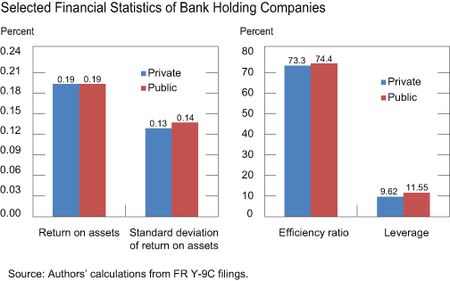
Public and private banks appear remarkably similar from an earnings perspective, with both types of banks earning a 0.2 percent return on assets (ROA) in the third quarter. The variability of their returns, as measured by the standard deviation of ROA in the preceding four quarters, is also similar on average. Additionally, public and private banks have similar efficiency ratios and leverage ratios on average.
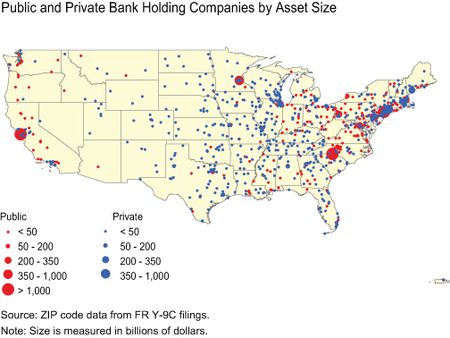
One difference between public and private banks appears to be geography—public banks are located closer to New York City and appear to be more prevalent on the coasts in general.
The PERMCOs in this post are used with the permission of the CRSP and the University of Chicago’s Booth School of Business. PERMCO is a registered trademark of the University of Chicago. The University of Chicago and the CRSP make no warranty of any kind, express or implied, with respect to the validity, merchantability, fitness, condition, use, or appropriateness of PERMCOs or the links to the PERMCOs in this post.
Disclaimer
The views expressed in this post are those of the authors and do not necessarily reflect the position of the Federal Reserve Bank of New York or the Federal Reserve System. Any errors or omissions are the responsibility of the authors.
 Anna Kovner is a senior economist in the New York Fed’s Research and Statistics Group.




 RSS Feed
 Follow Liberty Street Economics