Jason Bram and James A. Orr
The U.S. economy lost more than 8 million jobs between January 2008 and February 2010. In contrast with earlier recessions, employment declines were seen across almost all states. The extent varied: In this recession, states with big housing busts generally saw steeper job losses, especially in construction, while some states also had severe job losses driven by manufacturing declines. One feature of this employment recovery is that it’s actually been quite uniform across states—and much more uniform than in earlier recoveries. With few exceptions, states appear to be marching in lockstep.
In this post, we look at where individual states now stand in terms of the employment recovery and note some commonalities. Somewhat surprisingly, in contrast with past cycles a state’s job-growth performance in the recovery to date appears largely uncorrelated to its rate of job loss in the 2008 downturn. We also show how there’s been less dispersion across states in the current employment recovery than in past cycles, and discuss possible contributing factors.
State Job Losses in the Great Recession and Recovery
Most states’ job losses during the Great Recession occurred over roughly the same period as the nation’s overall job loss of 6.5 percent—between January 2008 and February 2010. Over this period, job declines varied considerably across states.
The varying job-loss experiences of the states meant that at the bottom of the national employment cycle in February 2010 there was quite a wide variation in the amount of ground that states had to make up to get back to their peak employment levels. In the three-plus years since February 2010, the nation has reversed about three-quarters of the job loss. As a result, employment nationally remains slightly less than 2 percent below its January 2008 peak.
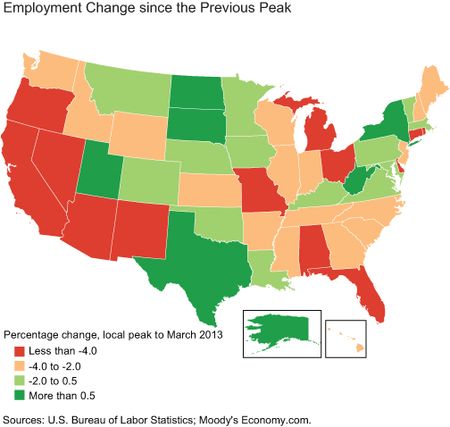
But here too there’s been quite a bit of variation across states in terms of how they’ve fared since their respective employment peaks, as shown in the map. The dark green states are the strongest performers; the light green states also outperformed the United States, but by less. A large band of states in the middle of the nation, as well as in parts of the northeast, tended to do well. Employment has fully rebounded, and then some, in New York and in several resource-rich states: Texas, Alaska, Utah, the Dakotas, and West Virginia. At the other end of the spectrum, the underperforming states (red and orange) tended to be clustered in the west, southeast, and midwest. Notably, employment is still down more than 4 percent from its prerecession peak, not only in housing-bust states like Florida, Nevada, and Arizona, but also in manufacturing-intensive states like Ohio, Michigan, Missouri, Alabama, and Connecticut.
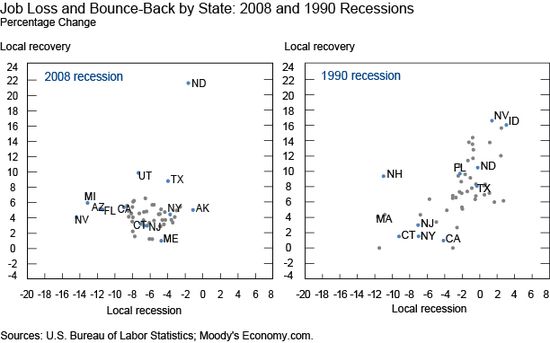
The following charts illustrate the relationship between a state’s job loss and the extent of its bounce-back. We plot the percentage decline in jobs from each state’s employment peak to trough in the 2008 and 1990 recessions on the x-axis and the percentage increase in jobs in its ensuing recovery (through March 2013 and through June 1994, respectively) on the y-axis.
The chart depicting the 2008 recession shows little relationship between the extent of state declines in employment and the extent of the bounce-back. The job-growth rates in the ensuing recovery are clustered in a fairly tight range around the 4.8 percent U.S. average, suggesting that states are closely mirroring the nation in terms of pace of recovery. A formal measure of the variation of job growth gives the same result: The employment-weighted standard deviation of job-growth rates across states was 2.62 percent in recession and 1.91 percent in recovery—thus, the greater dispersion horizontally than vertically.
In contrast, the general upward-sloping pattern of dots depicting the 1990 recession indicates that the hardest-hit states tended to be the slowest ones to bounce back (lower-left part of the chart). Conversely, the states most resilient to the downturn grew the fastest during the ensuing recovery (upper-right).
Several factors might explain this bunching of state growth rates following a period of wide variation. One is that past research has shown that a state that gets hit with a major shock sees the level of employment fall sharply but sees no sustained effect on its underlying growth rate. The bunching of growth rates in the recovery may actually represent a return to a more normal pattern of variation following the wide-ranging declines during the recession. Another explanation is that because financial conditions aren’t fully back to normal across the country and national fiscal policy has tightened, national and state employment growth is quite constrained. That is, all states are striving to overcome similar headwinds and struggling to grow employment. As these conditions subside and this somewhat abnormal period is behind us, wider variation in growth rates across states might reappear. It remains to be seen how the line-up of state growth rates will evolve.
Disclaimer
The views expressed in this post are those of the authors and do not necessarily reflect the position of the Federal Reserve Bank of New York or the Federal Reserve System. Any errors or omissions are the responsibility of the authors.
 Jason Bram is a senior economist in the New York Fed’s Research and Statistics Group.


 RSS Feed
 Follow Liberty Street Economics