Diego Aragon, Richard Peach, and Joseph Tracy
On October 5, 2012, the Federal Reserve Bank of New York and the Rockefeller Institute of Government co-hosted the conference “Distressed Residential Real Estate: Dimensions, Impacts, and Remedies.” This post not only makes available a compendium of the findings of the conference, but also updates and extends some of the analysis presented. In particular, we look across states to assess the differential impacts of judicial and non-judicial processes to resolve the foreclosure crisis. Controlling for the peak percentage of loans that were seriously delinquent, we find that non-judicial states are much further along in reducing the backlog of loans in foreclosure. In addition, controlling for the magnitude of the decline in home prices from peak to trough, we observe that home prices have recovered considerably more in the non-judicial states.
As the title of the conference suggests, the conference was devoted to three main topics. First, presenters gave an assessment of the national, state, and local volumes of properties that remained in the foreclosure and “real estate owned” (REO) pipeline. Second, experts presented research on the impacts of foreclosures and distressed sales on home prices, homeownership rates, communities and families, and state and local government finances. Third, a panel discussion explored policy initiatives intended to reduce the number of foreclosures and associated negative impacts.
National and state level data as of June 2012 were presented on the number of properties that were ninety-plus days delinquent, in foreclosure, and in REO. Also presented were alternative national and state level projections of future REO inventories under a range of alternative assumptions about the average numbers of days a loan stays in the ninety-plus-day delinquency status and the average number of days in foreclosure. These data were provided by CoreLogic under contract with the Federal Reserve Bank of New York and were made available on the Bank’s public website.
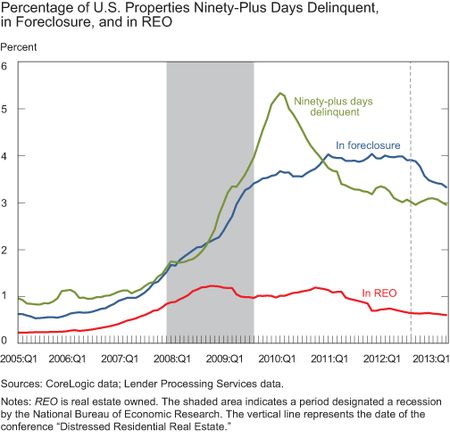
The chart below presents up-to-date national statistics on the percentage of first lien loans secured by one-to-four-unit residential properties that were ninety-plus days late, in foreclosure, or in REO. As of March 2013, just under 3 percent of all such loans were ninety-plus days delinquent—essentially unchanged from June 2012. This is below the peak of about 5½ percent reached in late 2009 to early 2010, but remains well above the prevailing average of just under 1 percent prior to 2007. In contrast, the percentage of loans in foreclosure, which had leveled off at around 4 percent from early 2011 through mid- 2012, declined to around 3½ percent by early 2013. This decline in the percentage of loans in the foreclosure process was due to a sharp decline in the number of loans flowing into foreclosure, such that for the past nine months more loans have moved out of foreclosure than moved in. Finally, the percentage of properties in REO continued to decline gradually over the period from mid-2012 to early 2013.
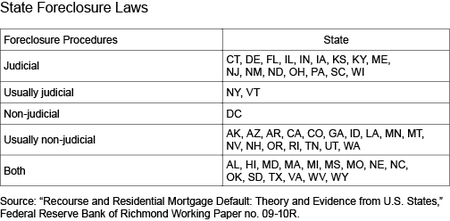
Underlying these generally favorable national trends is a large disparity in performance between states grouped into two categories—those that have a judicial foreclosure process and those that have a non-judicial process. Generally speaking, in judicial foreclosure states, key steps in the foreclosure process must be approved by a judge. This includes the approval of the sale of a property that has been pledged as collateral for a loan that has been declared to be in default. In contrast, in non-judicial states such key decisions are not processed through the courts, but rather are governed by statute.The table below lists states by their foreclosure law status. Note that the laws of many states allow for both types of procedures but that, in some cases, only one of the two types is followed most often. In the subsequent analysis of the performance of judicial versus non-judicial states, those “usually judicial” and “usually non-judicial” cases are included in the judicial and non-judicial categories, respectively.
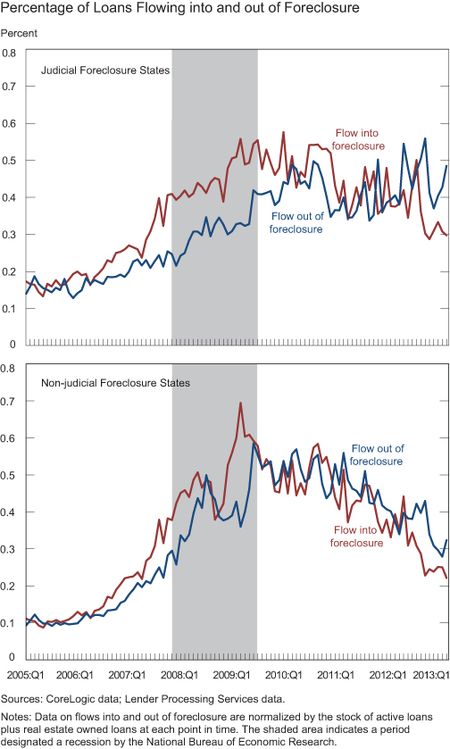
As noted at the conference, the average number of days that a mortgage loan is ninety-plus days delinquent at the time the foreclosure process is started is roughly comparable in judicial and non-judicial states. Moreover, as seen in the charts below, the percentage of loans in force flowing into foreclosure has been roughly comparable in both categories. The key distinction is in the rate of flow out of foreclosure or, alternatively, the average number of days a loan/property remains in the foreclosure process. The top panel of the chart below presents the percentage of loans in force flowing into foreclosure (red line) and flowing out of foreclosure (blue line) for judicial states while the bottom panel presents the same information for non-judicial states. It is evident from these data that throughout the crisis, the flow in and flow out remained much closer in the non-judicial states than was the case in the judicial states. This explains why the judicial states continue to have a relatively high stock of loans/properties in foreclosure.
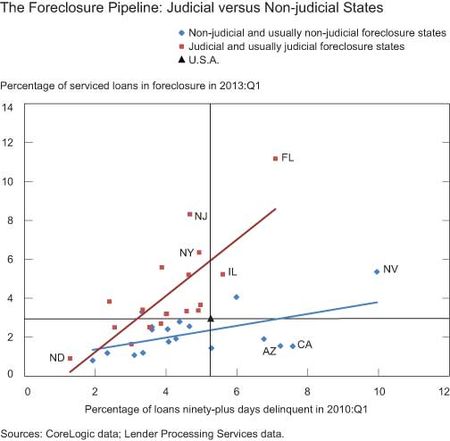
The difference between the judicial and non-judicial states is seen more clearly in the following scatter plot. The horizontal axis measures a state’s ninety-plus-day delinquency rate in the first quarter of 2010, which is the date of the national peak ninety-plus-day delinquency rate. The vertical axis measures a state’s foreclosure rate in the first quarter of 2013. The blue diamonds represent non-judicial and usually non-judicial states while the red squares represent the judicial and usually judicial states. The corresponding blue and red lines are least squares regression results for the respective sets of observations. For a given level of the ninety-plus-day delinquency rate in the first quarter of 2010, the judicial states have considerably higher foreclosure rates in early 2013, indicating that the length of time a loan/property remains in the foreclosure process in the judicial states is considerably longer than in the non-judicial states. New York, New Jersey, and Florida stand out as the most extreme examples of this phenomenon.
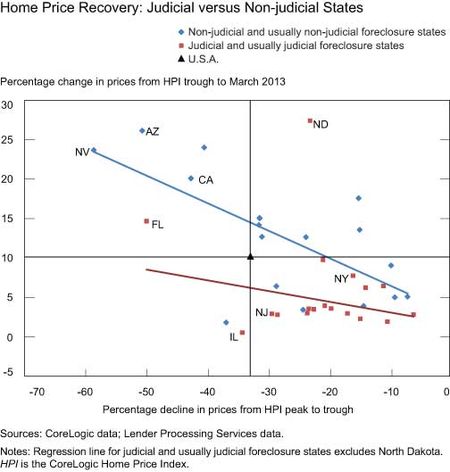
The considerably larger volume of loans in the foreclosure process in the judicial states appears to be impeding home price recovery in those states. Shown in the chart below is a cross tabulation of the individual states with the percentage decline in home prices from peak to trough on the horizontal axis and the change in prices from trough to the present on the vertical axis. Again, least squares lines have been fitted through the respective groupings of states. For a given peak-to-trough decline in home prices, the judicial foreclosure states have seen a meaningfully more modest improvement in home prices since the trough. (The exception to this general rule is the state of North Dakota, which has a relatively small population and is currently experiencing an energy-related economic boom resulting in housing shortages.) One potential explanation for this relationship is that potential homebuyers in the judicial states recognize that a large number of distressed sales have yet to occur, and this consideration has influenced the prices they are willing to offer for homes currently on the market.
There is a growing body of research indicating that delays in the foreclosure process impose significant costs, and ultimately do not make foreclosure less likely. The analysis presented here suggests that one cost of the foreclosure delays is the deferred recovery of home prices.
Disclaimer
The views expressed in this post are those of the authors and do not necessarily reflect the position of the Federal Reserve Bank of New York or the Federal Reserve System. Any errors or omissions are the responsibility of the authors.
 Diego Aragon is a senior policy associate with the Regional and Community Outreach division of the Federal Reserve Bank of New York’s Communications Group.
 Richard Peach is a senior vice president in the Bank’s Research and Statistics Group.
 Joseph Tracy is an executive vice president and senior advisor to the president of the Bank.


 RSS Feed
 Follow Liberty Street Economics