Meryam Bukhari, Alyssa Cambron, Michael J. Fleming, Jonathan McCarthy, and Julie Remache
The System Open Market Account (SOMA) is a portfolio held by the Federal Reserve to support monetary policy implementation and reflects assets and liabilities (domestic, and some foreign) acquired through open market operations. The SOMA has attracted greater attention in recent years as, with the federal funds rate near its lower bound, the size and composition of the domestic portfolio has been used as an active monetary policy instrument. Earnings on the SOMA portfolio represent a significant amount of the Fed’s income and, given the substantial increase in the size of the portfolio and shift in its composition, income has increased notably, with remittances to the Treasury totaling $88.4 billion in 2012.
Given increased interest in the Fed’s balance sheet and income, we’re writing a series of blog posts on the SOMA portfolio and the income it generates. The series authors will show how much this income has varied over time, describe the range of unrealized gains and losses that the portfolio has experienced as interest rates have changed, and present a counterfactual example to illustrate how the portfolio might have evolved had the Federal Open Market Committee (FOMC) not used the Fed’s balance sheet to pursue its statutory dual mandate in the face of the recent financial crisis and the ongoing, slow economic recovery. The authors will also discuss how this income is just one channel through which the Fed’s actions affect the overall fiscal position of the U.S. government.
In this first post, we provide some historical context on SOMA portfolio developments over time. In particular, we show that while the size and composition of the portfolio historically has played a more passive policy role, the role has evolved—being used at times to manage the level of bank reserves, to generate income for the Fed to cover operational expenses, or to achieve debt management objectives in concert with the Treasury. Consequently, the size and composition of the portfolio has shifted periodically since the Fed was established.
The Portfolio through the 1951 Treasury-Federal Reserve Accord
Section 14b of the Federal Reserve Act lists the assets that a Federal Reserve Bank may buy or sell in the open market. The list is generally limited to obligations issued by or fully guaranteed as to principal and interest by the United States or a foreign government, or an agency of the United States or a foreign government, as well as certain local government obligations. As such, the domestic SOMA portfolio has traditionally comprised securities issued by the U.S. Treasury—certificates, bills, notes, and bonds—although prior to 1975, the SOMA also held bankers’ acceptances, which are obligations of banks against future payments (LaRoche 1998).
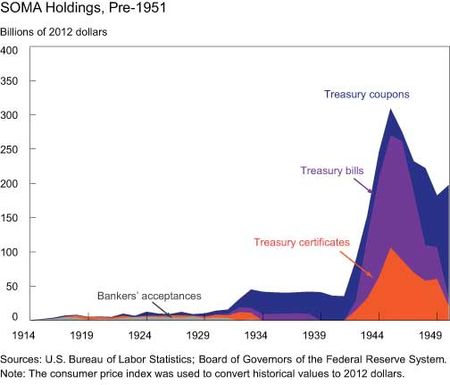
In the years immediately after the Fed’s founding in 1913, its major role was to meet the needs of commerce by lending against short-term bills generated in the ordinary course of production. The SOMA portfolio at that time was small and was used primarily to generate income to meet Fed operational expenses: Portfolio holdings totaled just $81 million in 1915 (approximately $1.8 billion in 2012 dollars) and consisted largely of bankers’ acceptances and some Treasury securities (Meulendyke 1998, p. 25). However, starting in 1924 the Fed began to use open market operations as a countercyclical policy tool to affect credit availability (Meulendyke 1998, p. 26; Hetzel 1985). The use of open market operations for monetary policy purposes from the 1920s onward was made possible by the expansion of government debt during World War I. With open market operations used more frequently with the onset of the Great Depression, the portfolio grew notably in the early 1930s and its composition shifted toward Treasury coupon securities (notes and bonds), as shown in the chart below. (Here is an interactive, extended version of the chart.) By the end of the 1930s, the composition of the portfolio was almost entirely comprised of such securities.
During World War II, the size of the portfolio surged as the Fed was an important agent for the Treasury’s management of the large debt issuance at the time. In particular, the Open Market Desk at the Federal Reserve Bank of New York purchased Treasury securities and set rates on the debt auctioned on behalf of the Treasury to maintain favorable borrowing conditions for the government (see Eichengreen and Garber [1991]). As a result, by the end of the war the portfolio had increased from approximately $40 billion to more than $300 billion (2012 dollars), with much of it comprising Treasury bills and certificates. The arrangement with the Treasury continued in the immediate postwar years, and increased pressures on longer-term rates eventually led the Fed to purchase more longer-term securities. As the aforementioned chart shows, these purchases again shifted the composition of the SOMA from Treasury bills to Treasury coupon securities.
The Portfolio from 1951 through 2007
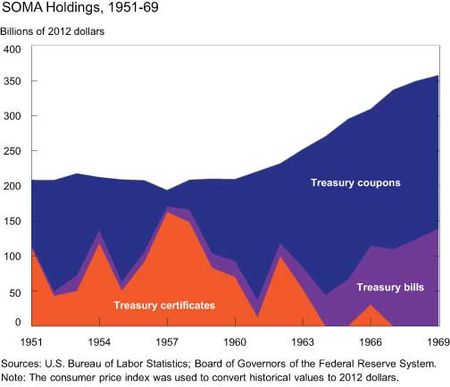
This operating framework for the portfolio continued until the Treasury-Federal Reserve Accord of 1951, which gave the FOMC the exclusive ability to set monetary policy without influence from the Treasury. In the decade following the Accord, the approach to managing the SOMA portfolio shifted toward management of the level of bank reserves to affect the availability of credit extended by commercial banks (see Meulendyke [1998, p. 36]). As shown in the chart below, during the 1950s the size of the portfolio remained fairly steady, as the Desk began executing repurchase agreements (effectively temporary collateralized borrowing and lending operations) to change the level of bank reserves rather than conducting permanent open market operations. While the size remained steady, the composition of the portfolio shifted back toward shorter-term, liquid instruments.
In the early 1960s, the composition of the portfolio shifted again toward longer-term securities under the original Operation Twist, a program aimed at lowering long-term interest rates without affecting the level of short-term rates (see Alon and Swanson [2011]) as a way to foster capital investment and economic growth without exacerbating the gold flows out of the United States that were occurring at that time. To execute Operation Twist, the Desk sold $9 billion (approximately $69 billion in 2012 dollars and 30 percent of the SOMA portfolio in 1961) of shorter-term Treasury certificates and purchased an equivalent amount of longer-dated Treasury coupons.
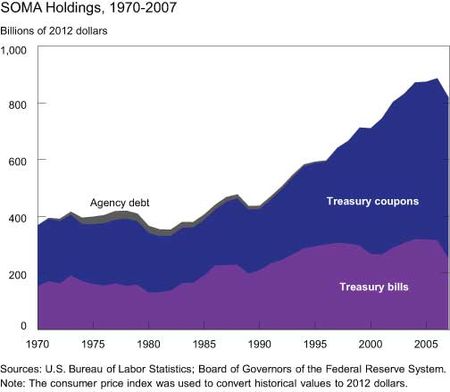
From the 1970s until the onset of the financial crisis, the operating procedures for the SOMA portfolio were to target reserves consistent with the FOMC’s desired value of some intermediate target variable: Usually the fed funds rate, but during the late 1970s and early 1980s the growth rates of monetary aggregates. During this period, the portfolio expanded at roughly the same pace as currency in circulation, and it was split largely between Treasury bills and coupons with an emphasis on short-dated holdings and liquidity, as shown in the next chart. On average, the weighted average maturity (WAM) of Treasuries held in the portfolio was 3.7 years over this period, with bills representing roughly one-third to one-half of the total portfolio.
The Portfolio since 2007
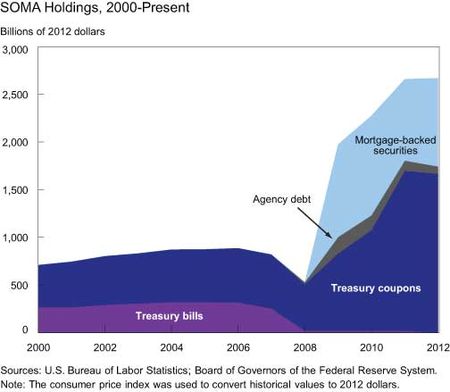
The Fed’s response to the financial crisis that started in 2007 had large effects on the balance sheet. Initially, the provision of liquidity through facilities such as the Term Auction Facility and through central bank liquidity swaps was offset through reductions in the SOMA’s securities holdings in order to maintain a steady balance sheet size and level of bank reserves. By the end of 2008, the domestic securities portfolio fell from approximately $750 billion to $500 billion, although the WAM increased significantly, to 6.8 years, because the size reduction occurred primarily through redemptions and sales of short-term securities.
However, with the fed funds target lowered to the zero lower bound in December 2008, further scope to use the normal policy tool of reducing short-term rates didn’t exist. For this reason, the FOMC began to use the SOMA portfolio more actively as a direct tool of monetary policy, purchasing longer-term assets as a means to reduce private sector holdings of such assets and thus reduce term premia and long-term interest rates (see Gagnon et al. [2010]). As the following chart illustrates, under the various initiatives, including large-scale asset purchases of Treasury, agency debt, and agency mortgage-backed securities (MBS), the SOMA portfolio increased to $2.7 trillion at the end of 2012—more than triple its size before the financial crisis and well in excess of the level of currency in circulation. The composition of the portfolio changed greatly with the addition of agency MBS and agency debt securities. Furthermore, the Treasury portfolio shifted further to longer-term securities, largely due to the introduction of the Treasury Maturity Extension Program, with the WAM rising to 10.4 years at the end of 2012. Further purchases under the current asset purchase programs will increase the size of the SOMA portfolio and maintain the composition toward longer-term assets.
Disclaimer
The views expressed in this post are those of the authors and do not necessarily reflect the position of the Federal Reserve Bank of New York or the Federal Reserve System. Any errors or omissions are the responsibility of the authors.
Meryam Bukhari is a senior analyst in the Federal Reserve Bank of New York’s Markets Group.
Alyssa Cambron is an associate in the Markets Group.

Michael J. Fleming is a vice president in the Bank’s Research and Statistics Group.

Jonathan McCarthy is a vice president in the Research and Statistics Group.


 RSS Feed
 Follow Liberty Street Economics
Very effective presentation. Maybe the whole series on a single log scale?
Excellent first note in this series. I am looking forward to more. You might consider showing a plot of the effective duration or WAM of the SOMA portfolio, perhaps using a new righthand scale and a line plot superimposed on each existing chart.