Olivier Armantier, Giorgio Topa, Wilbert van der Klaauw, and Basit Zafar
Note: We aren’t releasing the underlying data yet, but we’ll be making them available to the public sometime in first-quarter 2014. So please stay tuned.
In this fourth and final post in our series describing the new FRBNY Survey of Consumer Expectations (SCE), we present the final component of the survey, dedicated to household finance. The information collected in the SCE on household income, spending, and access to credit will provide a real-time picture of U.S. households’ situation and perceptions as well as rich and unique data for use by policymakers, researchers, and the public. While other surveys, such as the triennial Survey of Consumer Finances, provide data on the finances of U.S. families, few data sources provide timely information on such a broad set of outcomes.
Household Income, Spending, and Tax Expectations
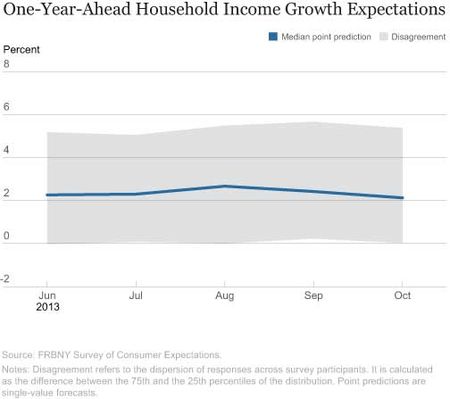
The first set of questions we ask is concerned with changes in the respondent’s household income. In the chart below, we plot summary statistics (that is, the 25th, 50th [the median], and 75th percentiles) describing the distribution of responses to the question “Over the next twelve months, what do you expect will happen to the total income of all members of your household (including you) from all sources before taxes and deductions?” As the chart shows, the distribution of point predictions has been essentially stable between June and October 2013. In particular, the median point prediction has hovered between 2.1 percent and 2.6 percent growth, with a slight decline over the last two months.
To put these figures into perspective, we compare them with the inflation point forecasts expressed earlier in the survey (see the second post in our series). Over the next twelve months, the median household income growth is around two percentage points lower than the median inflation point prediction. The chart also shows that the heterogeneity across respondents (as measured by the 75th and 25th percentiles) has been stable. Finally, it’s worth noting that between June and October about one in five SCE respondents reported that they expect their household income to decrease over the next twelve months.
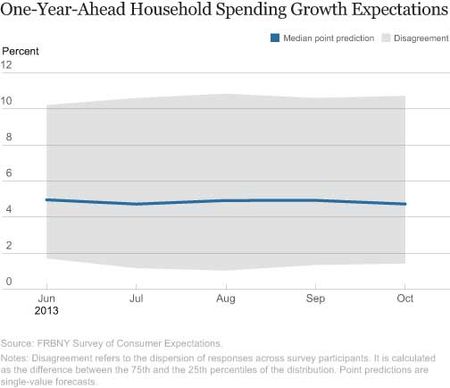
We now turn to the question about expected changes in total household spending. In the next chart, we plot the distribution of responses to the question “Over the next twelve months, what do you expect will happen to the total spending of all members of your household (including you)?” Again, the distribution of point forecasts has been very stable between July and October 2013. In particular, the median point forecast has remained between 4.7 percent and 5.0 percent, with a slight decline in the last month. Comparing these responses with those in the previous chart, we see that the median respondent anticipates her household spending to increase by roughly twice as much as her household income over the next twelve months. Note also that there’s greater cross-sectional variation in the responses to the spending question, as indicated by the larger difference between the 75th and the 25th percentiles relative to the previous chart. Finally, it’s worth noting that in every month roughly one in five respondents reported that they expect their household spending to decrease over the next twelve months.
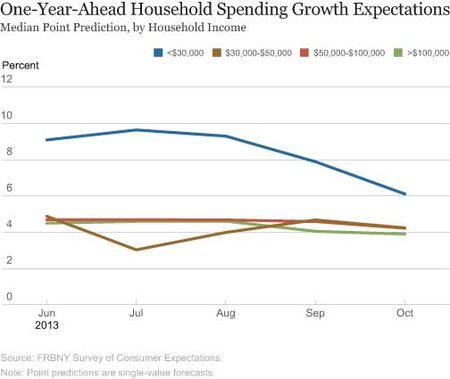
One of the interesting features of how we’ll report the results of the SCE is that readers will be able to look them up by particular demographic characteristics, such as age, income, or education. In the chart below, we plot the median point predictions of year-ahead household spending changes by income level. We see that the median point forecasts are very similar (around 4.5 percent) for households with income above $30,000. In contrast, households in the lowest-income group (below $30,000) report a median predicted spending growth of between 9.6 percent and 6.1 percent, much larger than that of the other income groups. Furthermore, the median spending point prediction of the lowest-income households has decreased steadily since July, in contrast with other income groups whose point predictions have remained stable over the same period.
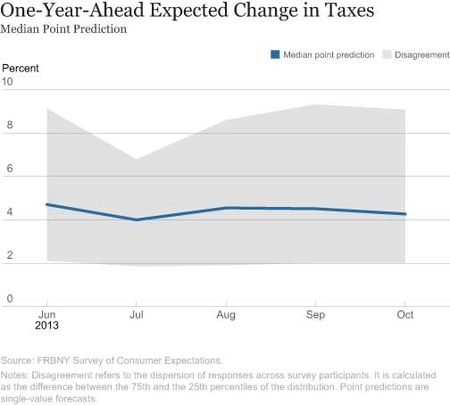
We also ask respondents for changes in the amount of taxes they expect to pay. In the next chart, we plot the distribution of responses to the question “Suppose that twelve months from now, your total household income is the same as now. What do you expect to have happened to the total amount of taxes you will have to pay, including federal, state and local income, property, and sales taxes?” We see that the median response has declined slightly, from 4.7 percent to 4.3 percent, between July and October. Finally, note that few respondents report no change or a decrease in the amount of taxes they expect to pay (5.6 percent and 6.5 percent of the respondents, respectively).
Household Credit Access Expectations
The SCE includes several questions aimed at assessing credit-related conditions and expectations for U.S. households. The first two survey questions that we now discuss provide a real-time picture of perceptions of credit supply for U.S. households.
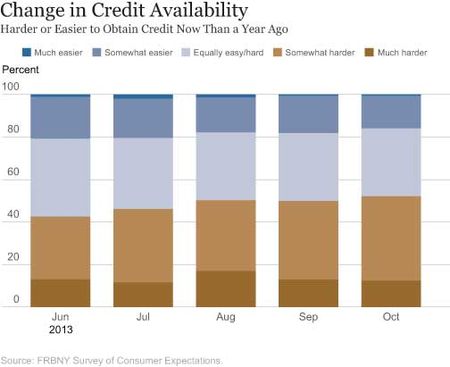
The chart below shows the distribution of responses to the question regarding perceptions of current credit availability: “Compared to twelve months ago, do you think it is generally harder or easier these days for people to obtain credit or loans (including credit and retail cards, auto loans, student loans, and mortgages)?” Perceptions regarding current credit availability have worsened somewhat since June 2013: While 42 percent of households reported somewhat or much harder credit access (relative to a year ago) in June, the corresponding proportion was roughly 50 percent in September and in October. Similarly, the proportion of households reporting somewhat or much easier credit access declined from 21 percent in June to 16 percent in October.
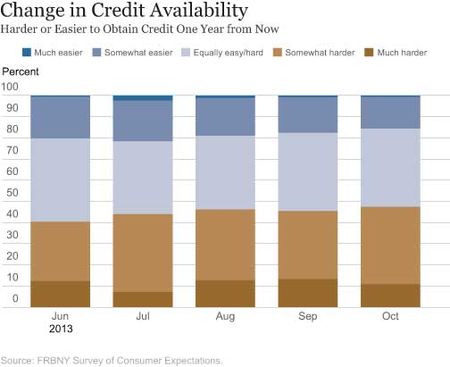
Perceptions regarding expected credit access twelve months from now (relative to today) are reported in the next chart. As in the case of current credit access, the proportion of respondents who expect somewhat or much easier future credit access has also declined, from 20 percent in June to 16 percent in October. The proportion expecting somewhat or much harder future access has oscillated between 40 percent and 47 percent between June and October. Comparing perceptions of future and current access, we see that respondents are more optimistic about the future.
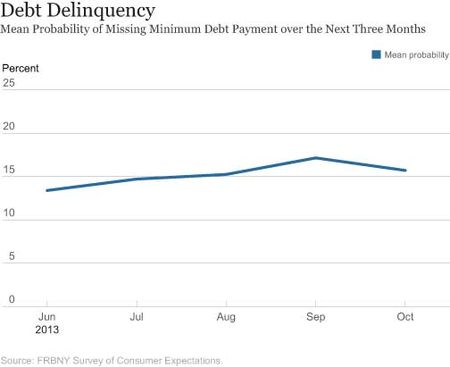
To capture the extent to which households expect to be financially constrained in the short term, the survey asks respondents: “What do you think is the percent chance that, over the next three months, you will NOT be able to make one of your debt payments (that is, the minimum required payments on credit and retail cards, auto loans, student loans, mortgages, or any other debt you may have)?” Like many of the other questions in the SCE, this one uses a probabilistic format that allows respondents to express uncertainty about the occurrence of this event. The chart below shows that the average likelihood of being unable to make minimum debt payments has remained within a narrow range of 13 percent to 17 percent since June, with a slight increase over this period. A closer look at the data shows that over this period, between 40 percent and 44 percent of respondents assign a zero chance (absolute certainty) to this event. Furthermore, between 8 percent and 12 percent of households give a more than even chance of missing minimum debt payments in the next three months.
Going forward, we believe the Survey of Consumer Expectations will provide useful and timely updates about the current financial situation of U.S. households as well as how households anticipate their financial situation to change in the future. By monitoring expectations for future outcomes, such as income and credit access, the SCE will provide important insight to policymakers to formulate effective policy. Furthermore, the ability to track expectations and outcomes for specific demographic groups will help them design more precisely targeted policies. Finally, the time series produced by the SCE will be of great value to economists who study the extent to which expectations influence actual economic outcomes.
Disclaimer
The views expressed in this post are those of the authors and do not necessarily reflect the position of the Federal Reserve Bank of New York or the Federal Reserve System. Any errors or omissions are the responsibility of the authors.

Olivier Armantier is an assistant vice president in the Federal Reserve Bank of New York’s Research and Statistics Group.

Giorgio Topa is a vice president in the Research and Statistics Group.

Wilbert van der Klaauw is a senior vice president in the Research and Statistics Group.

Basit Zafar is a senior economist in the Research and Statistics Group.


 RSS Feed
 Follow Liberty Street Economics
Response to first comment: We intend to include more specific questions about spending and savings in one or more quarterly modules, and in our future research hope to link aggregate expectations in our survey to spending data from external sources. Response to second comment: Thank you for your interest in the data. The statistics underlying the charts will be released starting in January. Underlying micro data from each monthly survey will be released after a nine-month delay. The data will be posted on our Center for Microeconomic Data website at http://newyorkfed.org/microeconomics/data.html
Obviously there is a built in assumption that perceptions may drive behavior in terms of savings and spending rates. It would be wonderful to have a deep dive into the actual spending patterns of at least a small subsample of the respondents in the study either through anthropological methods or perhaps through access to their Mint or Yodlee data. Obviously the latter approach may skew the data since anyone on those sites has certain characteristics that differ from the population in general. Probably this is wishful thinking that you have the budget for this 🙂
Where is the SCE data to be posted and/or is it already available? Thank you.