Gara Afonso, Alex Entz, and Eric LeSueur
The federal funds market plays an important role in the implementation of monetary policy. In our previous post, we examine the lending side of the fed funds market and the decline in total fed funds volume since the onset of the financial crisis. In today’s post, we discuss the borrowing side of this market and the interesting role played by foreign banks.
The Federal Funds Market Today
As in our prior work, we use publicly available regulatory filings to estimate the size and composition of fed funds borrowing activity. We aggregate data from regulatory filings, including FFIEC 002, FFIEC 031, FFIEC 041, FR Y-9C, call reports, 10-Ks, and 10-Qs, to piece together a picture of the fed funds market. While comprehensive data on this market aren’t available, conversations with market participants suggest that these filings capture most transactions. Our estimates of aggregate borrowing are broadly in line with our aggregate lending figures, and point to a significant reduction in borrowing activity since 2008.
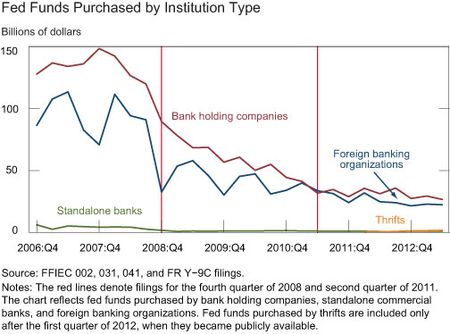
As shown in the chart below, depository institutions of bank holding companies (BHCs) and foreign banking organizations (FBOs) account for the vast majority of borrowing activity (fed funds purchased), with limited activity by other eligible borrowers, including thrifts and standalone commercial banks.
Who’s Borrowing More: Foreign or Domestic Banks?
A closer look at the chart reveals the predominant role that foreign banks play in the fed funds market. On average in 2012, FBOs borrowed close to $30 billion, accounting for 42 percent of the fed funds traded in this market.
Moreover, this is only a lower bound of the foreign activity since many BHCs are foreign owned. To get a better understanding of borrowing activity by domestically owned institutions compared with foreign-owned institutions, we divide our sample into “domestic entities” and “foreign entities” based on the location of the highest filer in the company hierarchy. The dynamic chart shows that, since 2009, foreign entities have consistently purchased more fed funds than domestic entities have.
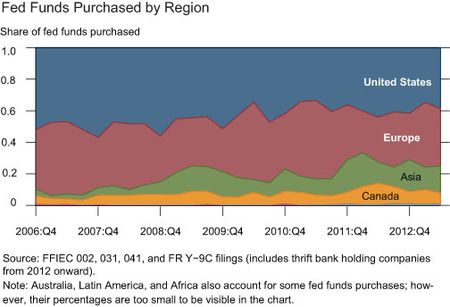
As shown in the next chart, European institutions are the most active foreign borrowers, followed by Asian and Canadian banks.
Why Are Foreign Banks Borrowing More than Domestic Banks?
Differences in institutional structures, as well as in regulation and requirements, may help explain why foreign banks have been more active borrowers than domestic banks in recent years. As we discuss in our previous post, trading dynamics in the fed funds market have changed following the expansion of the Federal Reserve’s balance sheet and the payment of interest on excess reserves (IOER).
The increased level of excess reserves in the banking system has reduced the structural need of many institutions to borrow fed funds for cash management or funding purposes. The decline in domestic bank fed funds borrowing relative to that of foreign banks may reflect their differential access to dollar liquidity, as domestic banks typically have more access to retail deposits as well as to other sources of stable funding, such as advances from Federal Home Loan Banks.
Under the new dynamics of the fed funds market, borrowing transactions can reflect arbitrage activity between fed funds rates and IOER. Borrowing institutions have an incentive to borrow fed funds at a rate below the IOER rate and then hold their borrowed funds in their reserve account to receive IOER and thus earn a positive spread on the transaction. Differences in capital requirements may make such transactions comparatively more attractive for foreign banks.
A change in the calculation of the Federal Deposit Insurance Corporation (FDIC) deposit insurance fee in 2011 likely reinforced the relative attractiveness of fed funds borrowing for foreign banks (which are generally not FDIC insured) versus domestic banks. In 2011, the FDIC expanded its deposit insurance assessment base from deposits to average consolidated total assets minus average tangible equity. For domestic banks, this meant an increase in the effective cost of borrowing fed funds to arbitrage IOER since these transactions now increase their FDIC fees.
In sum, to look for answers to our initial question of who’s currently borrowing in the fed funds market, we can’t just look at domestic institutions; we also have to focus our attention on foreign institutions—in particular, on European, Asian, and Canadian banks. These institutions are key players in a market that’s crucial for implementation of U.S. monetary policy. Many reasons explain their predominant role in this market, including institutional frictions and differences in regulation and requirements. More research is needed on this topic to better understand the implications of the fed funds market’s composition.
Disclaimer
The views expressed in this post are those of the authors and do not necessarily reflect the position of the Federal Reserve Bank of New York or the Federal Reserve System. Any errors or omissions are the responsibility of the authors.

Gara Afonso is an economist in the Federal Reserve Bank of New York’s Research and Statistics Group.

Alex Entz was a summer intern in the Group and is an undergraduate student at Northwestern University.

Eric LeSueur is a policy and markets analysis associate in the Bank’s Markets Group.


 RSS Feed
 Follow Liberty Street Economics
Dear, Referring to FDIC take-over financial institutions in the past six years and Fed funds purchase by institutions and regions,it seems there is an urgent necessity to enhance U.S. economy’s financial structure,which directs to U.S. economy’s inventory.In other words U.S. economy entitled to receive more than $26 trillion growth in 24 hours(resources allocation and financial management),which questions $14 trillion national debt increase in the past six years.The difference between $26 trillion growth in 24 hours and $14 trillion national debt increase in the past six years takes to U.S. gross income equation items,where a structural limitation shapes Govt. spending,gross investment & balance of trade’s import and export. thanks,Atif A. Taha,The Latest Edition
Does not it seem like a political risk, does it ?