Beverly Hirtle and Anna Kovner
Stress tests are important tools for assessing whether financial institutions have enough capital to operate in bad economic conditions. In addition to being useful for understanding capital weaknesses at individual firms, coordinated stress tests can also provide insight into the vulnerabilities facing the banking industry as a whole. In this post, we look at 2013 stress test projections made by eighteen large U.S. bank holding companies under the requirements of the Dodd-Frank Wall Street Reform and Consumer Protection Act and compare them with supervisory projections made by the Federal Reserve to see if the two sets of projections identify similar vulnerabilities and risks for the banking system.
Isn’t There Just One Stress Test?
In the wake of the financial crisis, Congress enacted the Dodd-Frank Act, which requires large bank holding companies (BHCs) and the Federal Reserve to do annual stress tests. One set of tests is based on three hypothetical macroeconomic scenarios developed by the Fed—a baseline scenario reflecting expected economic conditions over the next nine quarters, and adverse and severely adverse scenarios reflecting stressed economic and financial market conditions. In addition to stress tests based on the three Fed scenarios, both the Dodd-Frank Act and the Comprehensive Capital Analysis and Review (CCAR) require BHCs to perform stress tests based on their own scenarios. (An overview of the CCAR stress testing was described in a 2012 Liberty Street Economics blog post.)
The Federal Reserve published the Dodd-Frank Act Stress Test (DFAST) results under the severely adverse scenario in March of last year. For the first time, the individual BHCs subject to DFAST requirements also published their own projections. The two sets of results provide different perspectives on the risks facing the banking industry under badly stressed economic and financial market conditions.
Net Income Is a Key Stress Test Metric
The final outputs of the stress tests are projected regulatory capital ratios under the severely adverse economic and financial market conditions assumed in the Federal Reserve’s scenario. These stressed capital ratios are calculated by projecting BHC net income given scenario conditions and then calculating changes in regulatory capital based on those net income projections as well as on assumptions about common stock dividends, repurchases, and issuance over the stress test horizon. For the DFAST exercise, common stock dividends are assumed to be fixed at recent historical levels, and repurchases and new stock issuance are assumed to be zero, except for issuance associated with employee compensation.
The DFAST net income projections are a direct measure of the impact of the scenario on individual BHCs and, in the aggregate, on the U.S. banking industry. In the DFAST calculations, net income is calculated as pre-provision net revenue (PPNR)—equal to net interest income plus noninterest income minus noninterest expense—minus losses. Losses include losses on the loan portfolio, losses on securities held for investment, and, for the largest BHCs, mark-to-market losses on the trading portfolio. The net income projections thus capture estimates of the impact of adverse economic conditions not just on the value of assets held by the BHCs, but also on their broader business activities via projections of revenues and expenses in PPNR. As such, the net income projections are a good “summary statistic” of the impact of the stress scenario on the banking industry.
Comparing Supervisory and Industry Results
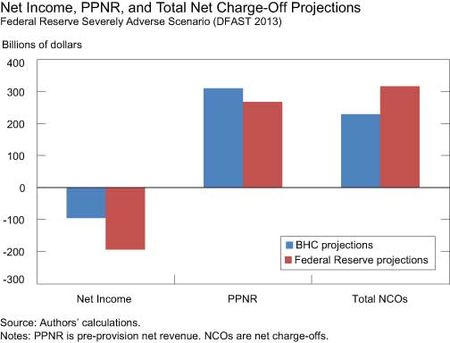
The chart below shows projections of net income and two of its key drivers—PPNR and loan net charge-offs—made by the Federal Reserve and by the eighteen individual BHCs that participated in DFAST 2013. The projections are cumulative for the nine quarters of the stress test horizon (from Q4 2012 to Q4 2014) under the Fed’s severely adverse scenario and are summed for the BHCs. As the chart illustrates, aggregate net income for the BHCs under the severely adverse scenario as projected by the Fed is much smaller than the aggregate of the BHC projections. Specifically, the Fed projects a loss of $194 billion while the BHCs project a loss of about $96 billion. The Fed’s larger projected loss reflects both lower projected PPNR and higher projected net charge-offs. Other elements of net income, including mark-to-market losses on trading positions, are not illustrated in the chart; most of the difference between the Federal Reserve and BHC projections is accounted for by PPNR and loan losses.
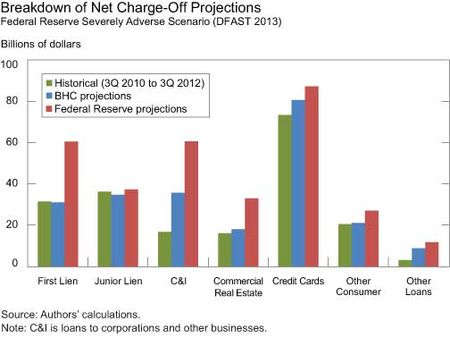
Aside from differences in the scale of the impact of the severely adverse scenario, the BHC and Fed projections suggest differences in the most significant sources of vulnerability for the banking industry in stressful conditions. The next chart begins to explore this question by reporting projected net charge-offs for seven different types of loans. As a point of comparison, the chart also includes bars representing actual charge-offs taken by these BHCs in the nine quarters immediately before the stress tests (that is, from 3Q 2010 to 3Q 2012).
The first thing to note is that different types of loans generate different amounts of losses, both in the projections and in the recent historical data. Some of this reflects differences in the amount of various types of loans held by the BHCs (for instance, the “other loans” component tends to be relatively small at most BHCs), while some represents differences in typical net charge-off rates (for instance, net charge-offs on credit card loans tend to be high compared to other forms of lending). As for the total charge-off projections shown above, the Fed’s projections of loan losses are higher than the BHCs’ in every loan category, though by varying degrees across loan types.
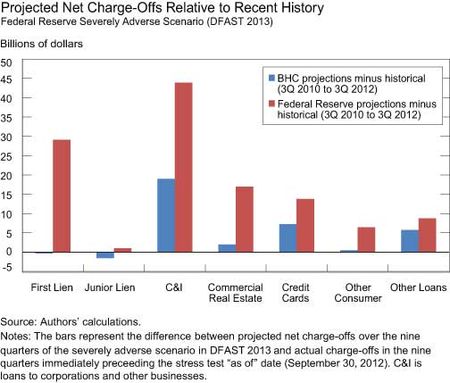
The following chart highlights these differences by showing the BHC and Federal Reserve net charge-off projections relative to recent historical charge-offs. The two sets of projections suggest that the largest increase in net charge-offs under the severely adverse scenario would come from loans to corporations and other businesses (C&I loans). The Fed and the BHC projections also agree about the smallest increase under the scenario: net charge-offs on residential junior lien and home equity lines of credit (HELOCs). Both sets of projections suggest that charge-offs on these loans would not increase significantly relative to recent history under the severely adverse scenario, most likely reflecting that recent net charge-offs on these types of loans have been very high by historical standards.
The projections are least aligned for first lien residential mortgages and commercial real estate (CRE) loans. For both loan types, the Fed’s projections suggest a considerable increase in net charg
e-offs relative to recent history under the severely adverse scenario, while the BHC projections suggest little or no increase. These categories of loans account for the second and third largest increases relative to recent history in the Federal Reserve projections, but are among the smaller increases in the BHC projections.
Differences in Perspective
The two sets of DFAST results provide different perspectives on the vulnerability of the U.S. banking industry to stressful economic and financial market conditions. In particular, the Federal Reserve projections suggest that losses on first lien residential mortgages and CRE loans would account for a much higher proportion of the total increase in loan losses than in the BHC projections. These differences could reflect variation in modeling approaches as well as differences in view about the extent to which additional losses could arise from loan portfolios that already experienced very significant losses during the financial crisis and in the recession that followed. Over time, as more DFAST results are published, it will be possible to track how these differences in perspective change, which will provide new insights into the vulnerabilities facing the banking industry.
BACKGROUND
2013 DFAST Results
Federal Reserve Board: Stress Tests and Capital Planning
Individual Banks’ Information on CCAR Projections
Disclaimer
The views expressed in this post are those of the authors and do not necessarily reflect the position of the Federal Reserve Bank of New York or the Federal Reserve System. Any errors or omissions are the responsibility of the authors.

Beverly Hirtle is a senior vice president in the Federal Reserve Bank of New York’s Research and Statistics Group.

Anna Kovner is a research officer in the Group.


 RSS Feed
 Follow Liberty Street Economics