Jason Bram and Richard Deitz
Today, the Federal Reserve Bank of New York begins releasing its monthly survey of regional business activity, called the Business Leaders Survey. This survey is a close cousin of our Empire State Manufacturing Survey, with some differences. The Business Leaders Survey covers the service sector rather than the manufacturing sector, and its respondents come from New York, northern New Jersey, and southwestern Connecticut, instead of just New York State. This new monthly release will provide another timely regional indicator to help gauge both local and national business cycles, and it will be available well before hard economic data on the region from other sources become available. In this post, we show that data from the survey, which have been collected monthly since 2004, provided some early signals about the most recent recession and recovery, at both the national and regional levels. The January 2014 survey points to continued modest growth in service-sector activity in the region, coupled with increasingly widespread optimism about future conditions.
How Does This Survey Compare with the Empire State Manufacturing Survey?
The Business Leaders Survey is quite similar to the Empire State Manufacturing Survey. Our panelists include about 100 businesses, with the proportion of respondents in each nonmanufacturing sector reflecting that industry’s share of economic activity. Because the Business Leaders Survey is geared toward service-sector firms, the survey questions differ somewhat from those in the Empire State Manufacturing Survey: instead of asking about things such as inventories and unfilled orders, which pertain primarily to companies that produce goods, we ask about wages and the general business climate. However, the gist of the survey is the same: respondents report on how various business indicators have changed recently and how these indicators are expected to change in the next six months. Based on responses to these questions, we compute diffusion indexes—the proportion of respondents reporting that an indicator has increased minus the share of respondents saying it has decreased—that serve as a summary measure of the indicator in question (we treat the business climate index somewhat differently, as explained below). The “headline” index in the Business Leaders Survey is the general business activity index, since this indicator broadly captures whether activity has increased or decreased for firms in the region.
The Business Activity Index Tracks the Business Cycle
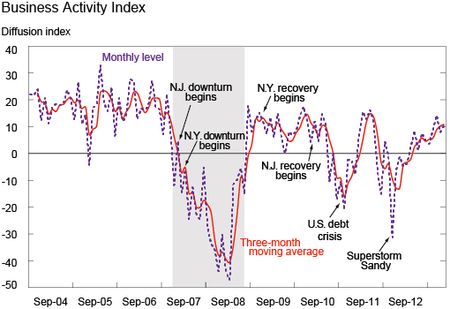
Although we are only now starting to release our results publicly, we have been conducting the survey since 2004. So we have nearly a decade of history to gauge how well some of the survey’s indicators have performed. As for tracking regional economic activity, the general business activity index appears to have signaled both the onset of the last downturn and the ensuing recovery, as shown in the chart below. The index began to drop precipitously in late 2007, and by December, it had slipped well below zero—a level generally viewed as the threshold between economic growth and contraction. If the survey had been released during that time, it would have provided some early and valuable intelligence about the region’s downturn—which began in January 2008 in New Jersey and two months later in New York State, according to our Indexes of Coincident Economic Indicators. By March 2009, the index had fallen to a grim level of -47. But in April and May of that year, the index rebounded sharply, and by August, it had vaulted into positive territory. This was just three months before New York’s economic recovery began (although New Jersey’s economy did not recover for another year). Moreover, the drop and subsequent rebound in this headline index also closely coincided with the official start and end of the national recession—indicated by the gray shaded areas in the chart below.
Still, we should note that this index does not always accurately predict business cycles. For example, in the second half of 2011, during the debt ceiling crisis, this measure fell below zero for an extended period of time. Again, in November 2012, right after Superstorm Sandy, the index plunged to its lowest level since the recession.
The Business Climate Index
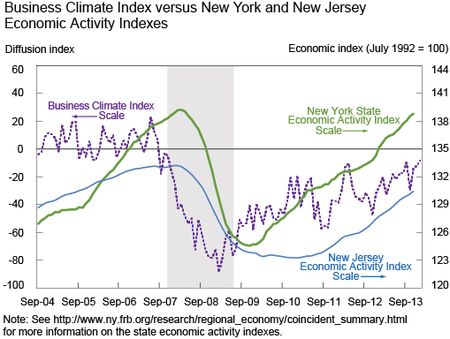
While most business surveys compute diffusion indexes based on how an indicator has changed, the Business Leaders Survey poses a question which asks respondents to assess the general business climate as being better or worse than usual. This measure provides a read on a different dimension of economic activity: how busy firms are—which yields information about the overall level of activity, rather than how fast activity is growing or contracting. As can be seen in the chart below, this indicator has been trending up, more or less, since the end of the recession. Yet only recently has it indicated that activity is approaching a “normal” level, consistent with an index reading of around zero. By way of comparison, the last time the climate index was above zero was late 2007, just before the recession.
This indicator also appears to do well at tracking regional business cycles. When we plot indexes of economic activity for New York and New Jersey against the Business Climate Index, we can see that the level of regional economic activity tends to follow the index. Further, the downturn in the index in late 2007 presaged the downturn in economic activity for these two states, and the business climate index began to turn up shortly before economic activity improved for the region.
Supplemental Report on Topical Economic Issues
Like the Empire State Manufacturing Survey, the Business Leaders Survey asks supplemental questions on various topics that change each month. These questions will be the same as those asked in the Empire Survey. Beginning this month, we will release a combined report assessing the answers to these questions from respondents to both surveys. The January 2014 survey topic is firms’ workforces. The results indicate that more than twice as many survey respondents in both the manufacturing and service sectors plan to expand rather than reduce staffing levels. These balances are considerably more positive than in last January’s surveys, though not quite as positive as in the January 2012 surveys. The most widely cited factors behind planned job expansions were high expected sales growth and the need for people with particular skills.
January 2014 Report Points to Continued Growth
Overall, the January 2014 report points to continued modest growth in service-sector activity for the region, coupled with increasingly strong optimism about future conditions. Looking ahead, this new set of data will give us timely information on whether conditions continue to improve.
Disclaimer
The views expressed in this post are those of the authors and do not necessarily reflect the position of the Federal Reserve Bank of New York or the Federal Reserve System. Any errors or omissions are the responsibility of the authors.
Jason Bram is a research officer in the Federal Reserve Bank of New York’s Research and Statistics Group.
Richard Deitz is an assistant vice president in the Research and Statistics Group.


 RSS Feed
 Follow Liberty Street Economics