Anna Kovner, James Vickery, and Lily Zhou
This post is the second in a series of thirteen Liberty Street Economics posts on Large and Complex Banks. For more on this topic, see this special issue of the Economic Policy Review.
Despite recent financial reforms, there is still widespread concern that large banking firms remain “too big to fail.” As a solution, some reformers advocate capping the size of the largest banking firms. One consideration, however, is that while early literature found limited evidence for economies of scale, recent academic research has found evidence of scale economies in banking, even for the largest banking firms, implying that such caps could impose real costs on the economy. In our contribution to the volume on large and complex banks, we extend this line of research by studying the relationship between bank holding company (BHC) size and components of noninterest expense, in order to shed light on the sources of the scale economies identified in previous literature.
Efficiency Ratio, A Normalized Measure of Bank Operating Costs
Noninterest expense includes a variety of operating costs incurred by banking firms: examples include employee compensation and benefits, information technology, legal fees, consulting services, postage and stationery, directors’ fees, and expenses associated with buildings and other fixed assets. Lower operating costs are a likely source of scale economies in banking, because large firms can spread overhead over a larger revenue or asset base.
Since dollar expenses mechanically increase with size, our analysis focuses on normalized measures of expenses, including the well-known “efficiency ratio,” defined as the ratio of noninterest expense to “net operating revenue,” the sum of net interest income and noninterest income:
A higher efficiency ratio indicates higher operating costs, or equivalently, lower efficiency. Effectively, this ratio measures the operating cost incurred to earn each dollar of revenue. Efficiency ratios vary widely across bank holding companies, but typical values range from 50 to 80 percent.
Large Bank Holding Companies Have Lower Noninterest Expense Ratios
Our analysis focuses on U.S. bank holding companies over the period 2001 to 2012. We find a negative relationship between bank size and noninterest expense ratios, robust to the expense measure or set of controls used. Quantitatively, a 10 percent increase in assets is associated with a 0.3-0.6 percent decline in noninterest expense scaled by income or assets. In dollar terms, our estimates imply that for a BHC of average size, an additional $1 billion in assets reduces noninterest expense by $1 to $2 million per year, relative to a base case where operating cost ratios are unrelated to size.
No Flattening of the Relationship between Size and Cost Even for the Largest BHCs
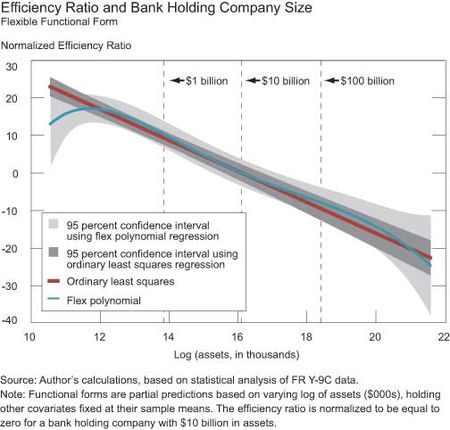
These results hold across the size distribution of banking firms and over different parts of our sample period. As shown in the chart below of the efficiency ratio and bank size, which is based on our statistical estimates, we find no evidence that these lower operating costs flatten out above some particular size threshold. This is in contrast to the early academic literature on scale economies, which suggested that these economies taper off above a relatively low size threshold. If anything, the estimated slope steepens, although the statistical uncertainty associated with the estimate becomes larger due to the small sample size.
Digging Deeper into BHCs’ Noninterest Expense
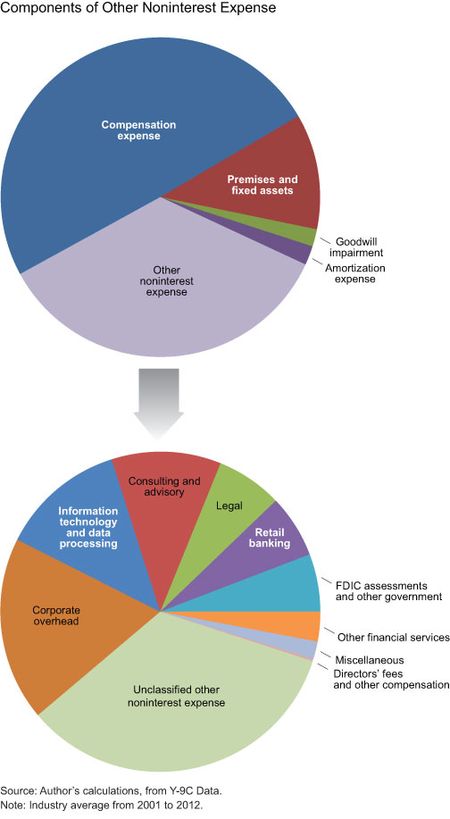
Our information on BHC noninterest expense comes from their FR Y-9C regulatory filings, which divide noninterest expense into five line items: employee compensation, premises and fixed-assets expenses, goodwill impairment, amortization, and “other” noninterest expense. As shown on the pie chart, compensation makes up about half of noninterest expense. By far the next largest category is “other,” which accounts for 35 percent of operating expenses over our entire sample period, rising to 40 percent of the total in 2012.
A key contribution of our paper is to dig further into the data to find out what makes up this “other” category of operating costs. For the period 2008 to 2012, we break down other noninterest expense into nine subcategories defined by us, using memoranda information from the FR Y-9C and manual classification of about 5,500 individual, write-in text fields reported by individual BHCs. These text line items run the gamut from the expected (data processing, owned real estate expenses, custodian fees) to the surprising (cattle feed, livestock). In sum, we’re able to classify about two-thirds of other noninterest expense using this approach. To our knowledge, ours is the first research paper to use these data.
A breakdown of these expenses is shown in the chart below. The largest category (18.6 percent of other noninterest expense) is corporate overhead, a category which includes general corporate expenses such as accounting, printing and stationery, postage, advertising, travel costs, and human resources. Next largest is information technology and data processing (12.6 percent of the total).
Not All Expenses Are Decreasing in Scale
Armed with this classification, we repeat our statistical analysis for the five components of noninterest expense, and for the detailed nine-category breakdown of other noninterest expense. Consistent with the aggregate results discussed above, we find an inverse relationship between BHC size and the noninterest expense ratio for each of the three main components of noninterest expense: employee compensation, premises and fixed-assets expenses, and other noninterest expense.
We do, however, find significant differences in the strength of this inverse relationship within the nine subcomponents of other noninterest expense. The inverse relationship between size and expenses is particularly negative for corporate overhead (such as accounting, printing, and postage), information technology and data processing, legal, other financial services, and directors’ fees and other compensation. In contrast, large BHCs spend proportionately more on consulting and advisory services than smaller firms, relative to revenue or assets. Large BHCs also incur proportionately higher expenses related to amortization and impairment of goodwill and other intangible assets.
Caveats
These findings suggest that an operating cost advantage in areas like compensation, corporate overhead, and information technology contributes to the economies of scale findings uncovered in previous banking research. It is, however, important to keep the following caveats in mind when
interpreting our results.
First, our estimates represent reduced-form statistical correlations; caution should be exercised in drawing a causal interpretation from them. For example, size may be correlated with omitted variables that are also associated with lower expenses, such as the quality of management.
Second, our results may reflect factors other than scale economies. One possibility, closely related to scale economies but conceptually distinct, is that large firms may operate closer to their production frontier on average. Another possibility is that large banking firms have greater bargaining power vis-à-vis their suppliers and employees. If cost differences are due only to bargaining power effects, then limiting the size of the largest BHCs would not necessarily generate deadweight economic costs, although it might reallocate economic rents to employees or suppliers.
It is also possible that our results are influenced by too-big-to-fail subsidies (for example, see the paper and forthcoming post by Santos in this series). It is likely that such subsidies would be more likely to be reflected outside of operating costs, for example, as a lower cost of funds for large firms, or a more leveraged capital structure. However, it is possible that a too-big-to-fail banking firm could respond by reducing spending on risk management; this would show up as lower noninterest expenses.
Conclusion
These caveats aside, our results and those of related research suggest that imposing size limits on banking firms is unlikely to be a free lunch. Taking our estimates at face value, a back-of-the-envelope calculation from our paper suggests that limiting BHC size to be no larger than 4 percent of GDP would increase total noninterest expense by $2 to $4 billion per quarter. Limiting the size of banking firms could still be an appropriate policy goal, but only if the benefits of doing so exceed the attendant reductions in scale efficiencies.
Disclaimer
The views expressed in this post are those of the authors and do not necessarily reflect the position of the Federal Reserve Bank of New York or the Federal Reserve System. Any errors or omissions are the responsibility of the authors.

Anna Kovner is a research officer in the Federal Reserve Bank of New York’s Research and Statistics Group.


 RSS Feed
 Follow Liberty Street Economics
Thanks very much for your comment, which raises a very important point. We haven’t explicitly tried to adjust income for the effect of any “too-big-to-fail” (TBTF) subsidy when computing the efficiency ratio. However, we have estimated our results using an alternative measure of operating costs in which we scale by total assets rather than by net operating income. We’ve also estimated a version of our results using the natural logarithm of noninterest expense as our measure of operating costs. We find similar results using these alternative measures. This suggests to us that our results are not driven by any direct effects of TBTF on bank profitability (since profitability doesn’t enter into these alternative variables). While this gives us some confidence in the robustness of our findings, it may still be possible (as we note in the paper) that TBTF affects our results in other ways—for example, a TBTF bank may invest relatively less in risk management because it relies to a greater extent on implicit government guarantees, leading to lower compensation expenses. Given the breadth of our results across different types of noninterest expense, we don’t think this explanation is likely to drive our overall results, but as always, further research on this question would be valuable.
Thanks for a very interesting analysis of a key subject. To what extent are the largest banks showing greater efficiency as a result of the boost to net income from the value of the public too-big-to-fail subsidy? Using the results about the value of too-big-to-fail subsidies obtained by your colleagues, it would be interesting to recalculate the efficiency ratio as (noninterest expense)/(net interest income – value of the TBTF subsidy + noninterest income) and to see what the fundamental efficiency of the largest banks, without subsidies, looks like.