Alyssa Cambron, Michael Fleming, Deborah Leonard, Grant Long, and Julie Remache
In August 2013, we wrote a series of blog posts on the use of the Federal Reserve’s System Open Market Account (SOMA) portfolio in monetary policy operations. Since the onset of the financial crisis, the Federal Open Market Committee (FOMC) has increased the size and adjusted the composition of the SOMA portfolio in efforts to promote the Committee’s mandate to foster maximum employment and price stability. Over time, these actions have also generated high levels of portfolio income, contributing in turn to elevated remittances to the U.S. Treasury. Today’s release of the New York Fed’s report Domestic Open Market Operations during 2013 offers an opportunity to update our blog series’ discussion of the portfolio’s income and unrealized gains and losses, and to revisit our counterfactual exercise exploring how the use of the portfolio to implement monetary policy has affected income.
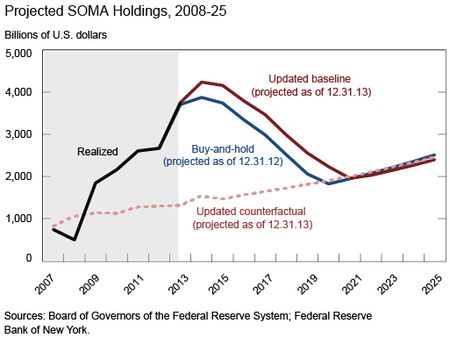
In “What If? A Counterfactual SOMA Portfolio,” we estimated the portfolio and income effects of the FOMC’s actions compared with a scenario in which the Fed responded to the financial crisis and slow subsequent recovery only by lowering the federal funds target. In order to reflect developments over the past year, we have updated this analysis. The new “baseline” scenario is the baseline in the report released today, which reflects actual balance sheet developments and market prices through December 31, 2013, and projected portfolio and interest rate paths based on results from the Desk’s January 2014 Survey of Primary Dealers. Over the past year, dealers’ median expectation for additional asset purchases (starting from January 2013) increased by $360 billion to an estimated total of $1.47 trillion, compared with prior expectations for about $1.1 trillion in total purchases. Moreover, dealers have pushed back the expected end date for asset purchases from early 2014 to late 2014, and they have pushed back the time when they expect the FOMC to start raising the federal funds target rate one quarter, to the fourth quarter of 2015. In line with the “buy-and-hold” scenario described in the addendum to our original post, we assume no assets are sold during the normalization process, consistent with discussions at the June 2013 FOMC meeting. The “counterfactual” scenario was also updated with historical interest rates for 2013 and the same subsequent projected interest rate path as used in the baseline.
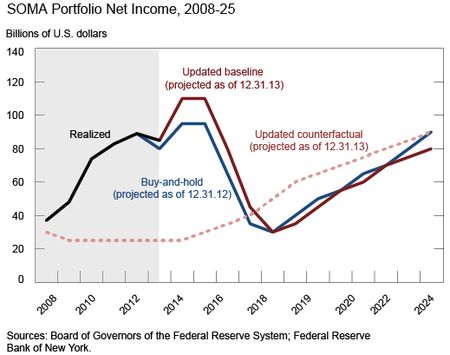
The realized and projected portfolio and income effects associated with this new information can be seen in the charts below. Under the counterfactual scenario, we estimate that total SOMA domestic securities holdings as of year-end 2013 are $1.3 trillion, roughly $2.5 trillion lower than the realized level of $3.8 trillion as of year-end 2013. Meanwhile, the larger and longer-lasting projected purchase program relative to our 2012 estimates lifts the projected peak size of the portfolio to a level of $4.2 trillion and maintains a larger portfolio during the longer reinvestment period associated with a later liftoff date. Compared with the 2012 “buy-and-hold” scenario, it also pushes out by over a year the date when the size of the portfolio is normalized, at which time Treasury purchases resume in line with trend currency growth and the baseline converges with the counterfactual.
The larger portfolio in the updated baseline is also projected to generate higher levels of SOMA net income in the near to medium term than we projected in our exercise a year ago. Cumulative net income from 2008 through 2025 is $350 billion more in the current baseline than in the counterfactual scenario, on net $55 billion higher. All else equal, higher portfolio net income boosts remittances to the Treasury. These findings are consistent with those of a recent research note by our colleagues at the Federal Reserve Bank of San Francisco, who conducted a stress test analysis of SOMA holdings. They found a high likelihood of a positive cumulative effect on net income and remittances from the Federal Reserve’s large-scale asset purchase programs relative to the pre-crisis historical trend.
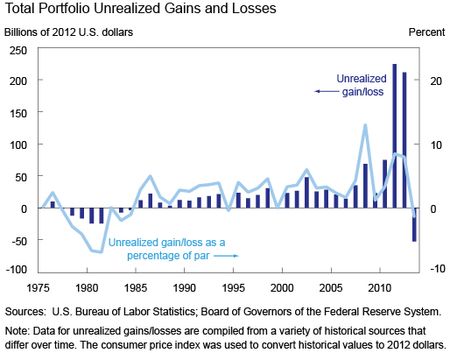
In “A History of SOMA Income,” another post from our 2013 series, we provided historical perspective on the portfolio’s income and market value. In today’s release, we show that realized net income from the SOMA portfolio was $84 billion in 2013, contributing to almost $78 billion of remittances to the Treasury last year. (Remittances are, of course, not the only means by which monetary policy influences the economy, and the fiscal implications of monetary policy must be considered in a broader context.) As we illustrated in that earlier post, this level of income is high by historical standards, and the realized numbers for 2013 are slightly higher than originally forecast in the projections described earlier in this post. The 2013 post also discussed how the market value of the SOMA portfolio—and therefore the related unrealized gains and losses—fluctuates with changes in interest rates. Today’s release shows how unrealized gains, defined as the difference between the market value of the portfolio and its accounting or book value (which reflects amortized cost), declined over the course of 2013. The sharp rise in longer-term interest rates in 2013 led to a decrease in the market value of the portfolio and resulted in the portfolio carrying an unrealized loss of about $53 billion at year-end, compared with an unrealized gain of about $215 billion at the end of 2012. While the fluctuations in interest rates were not anticipated by the market, the sensitivity of the portfolio’s valuation to such moves was a predictable result of the interest rate risk that’s been absorbed by the SOMA portfolio from the market through large-scale asset purchases. This reflects one of the channels through which such purchases are believed to ease financial conditions. Overall, the level of unrealized losses at the end of 2013 as a percentage of the portfolio is still quite low, especially in comparison with the early 1980s when interest rates were high and volatile. Moreover, unrealized losses have no effect on actual income unless the assets are sold from the portfolio.
Disclaimer
The views expressed in this post are those of the authors and do not necessarily reflect the position of the Federal Reserve Bank of New York or the Federal Reserve System. Any errors or omissions are the responsibility of the authors.

Alyssa Cambron is a quantitative policy/analysis associate in the Federal Reserve Bank of New York’s Markets Group.

Michael Fleming is a vice president in the Bank’s Research and Statistics Group.
Deborah Leonard is a vice president in the Markets Group.

Grant Long is a quantitative policy/analysis associate in the Markets Group.


 RSS Feed
 Follow Liberty Street Economics
Thank you for your inquiry. One of our blog posts from last summer provides such a breakdown in chart form and provides a link to an Excel file with the data: http://libertystreeteconomics.newyorkfed.org/2013/08/the-soma-portfolio-through-time.html The annual report released today provides holdings breakdowns as of the end of 2013 and also provides a link to a file with the data. In addition, portfolio holdings (along with the Federal Reserve’s entire balance sheet) are provided on a weekly basis in the H.4.1 statistical release from the Federal Reserve Board of Governors: http://www.federalreserve.gov/releases/h41/ Moreover, security-level portfolio holdings (also on a weekly basis, in line with the H.4.1) are available on the New York Fed’s website: http://newyorkfed.org/markets/soma/sysopen_accholdings.html
Do you have a sector breakdown of the portfolio? (ie MBS , TRES, Agency Debenture)