Mary Amiti and Benjamin Mandel
U.S. involvement in what could be one of the world’s largest free trade agreements, the Trans-Pacific Partnership (TPP), has garnered a lot of attention, especially since the entry of Japan into negotiations last year. The proposed free trade agreement (FTA) encompasses twelve countries, which combined account for 45 percent of U.S. exports and 37 percent of U.S. imports. This broad coverage of U.S. trade seems to suggest large potential gains for the U.S. from the agreement. However, three quarters of this trade is already within the U.S. free trade agreement with Canada and Mexico (the North American Free Trade Agreement (NAFTA)), making the assessment of potential gains to the TPP less clear cut. In this post, we investigate some implications of TPP for U.S. international trade, with a focus on identifying areas with the greatest potential for liberalization and, hence, benefits to U.S. exporters and consumers.
We find that while the potential gain from tariff reduction on the typical U.S. export or import is small (that is, for the average trading relationship across all products and countries), potential gains for a small subset of products and partners may be quite large. We highlight the role of agricultural products and the inclusion of Japan under a potential TPP deal for their outsized potential benefits. We also note that the extent of agricultural liberalization in the United States and Japan is highly uncertain. Reduction of agricultural subsidies and tariffs in advanced economies is a politically charged issue, and one credited for multiple derailments of the World Trade Organization (WTO) Doha round of multilateral negotiations prior to the recent deal. Therefore, given the lopsided distribution of tariff barriers and the complex political economy of agricultural industries in the United States and Japan, the expected value of the deal for U.S. trade arising from lowering import tariffs is correspondingly uncertain.
The United States entered into negotiations to join the TPP in February 2008. Since then, Australia, Peru, Vietnam, Malaysia, Mexico, Canada, and Japan have also joined the negotiations, a series of over twenty official meetings through December 2013. The TPP focuses primarily on promoting trade and investment. However, there are also many other issues on the table beyond trade, such as intellectual property protection and investor-state dispute settlement, which could turn out to be stumbling blocks. Since the specifics of the TPP pertaining to these other issues are not yet widely known and nontariff barriers are so difficult to measure, our focus will be on the potential gains arising from tariff reductions.
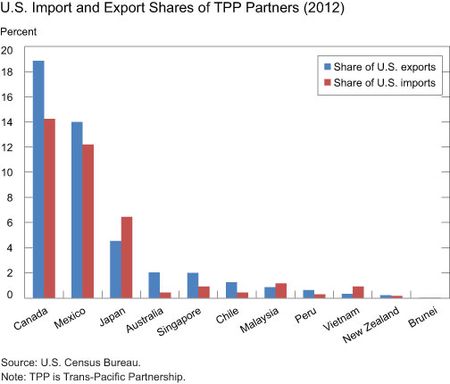
At first glance, the TPP does not represent a substantial opportunity to increase U.S. market access abroad. As illustrated in the chart below, while the share of U.S. trade covered by TPP partners is large, at roughly 40 percent of both imports and exports in 2012, free trade agreements already in place with Canada, Mexico, Australia, Singapore, Chile, and Peru represent the vast majority of this share. Almost three quarters is already covered by NAFTA alone. Therefore, if the tariff levels negotiated under the TPP are more or less in line with those in place under NAFTA and other bilateral agreements, the scope for further tariff reduction to current U.S. export destinations is limited. One exception is Japan, which accounts for 4.5 percent of U.S. exports and which does not have a bilateral free trade agreement in place with the United States.
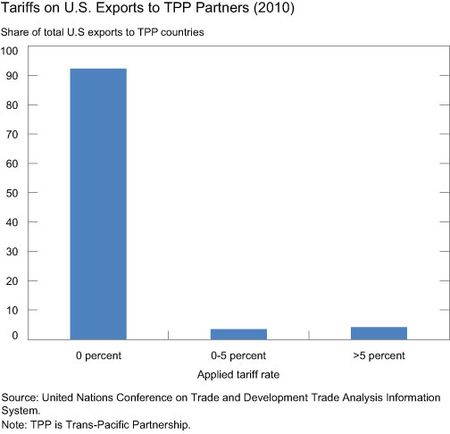
Even if the terms of the TPP were to call for greater tariff reduction than existing agreements, liberalization would be limited by the fact that most TPP countries (both those with and without an FTA) already have low average tariffs. For example, Singapore’s average tariff is zero while New Zealand’s is only 2 percent, even in the absence of an FTA with the United States. Of the potential TPP partners, Vietnam has the highest average tariff at 10 percent, followed by Mexico at 9 percent and Malaysia at 7 percent. The average U.S. tariff on imports is only 3.5 percent. Therefore, the value of U.S. exports and imports currently affected by intra-TPP tariffs appears correspondingly low. Focusing on U.S. exports, the applied tariff rate for about 90 percent of exports to TPP partners is zero.
Some notable exceptions exist. For about 5 percent of U.S. exports to TPP countries, tariffs are greater than 5 percent, with some as high as 24 percent in the 99th percentile. Many of the highest applied tariffs were on goods imported by Vietnam. The question is then whether these large tariffs represent the low-hanging fruit for further liberalization or, on the contrary, stem from the most steadfast of protectionist industries that were able to withstand pressure to reduce tariffs under the WTO and other FTAs.
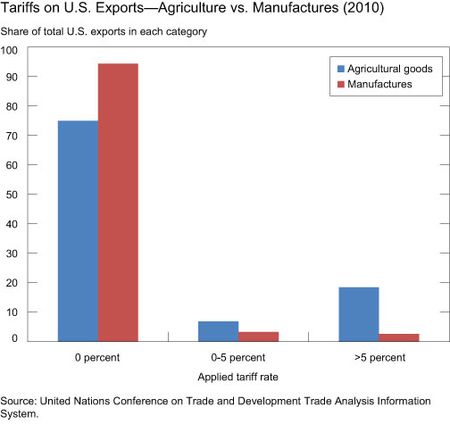
We suspect it is the latter. A closer examination of the data shows that these high tariffs are used predominantly in agricultural industries. The chart below shows that high tariffs are currently applied on about 20 percent of the value of U.S. agricultural exports to TPP countries. Agriculture, in turn, accounts for 7 percent of total U.S. exports, and half of these are shipped to TPP countries. The prevalence of high agricultural tariffs is an ominous sign, given a history of exceptions and delays for trade liberalization in prior agreements. For example, under NAFTA, it took up to fifteen years to phase in tariff reductions for the most sensitive agricultural products.
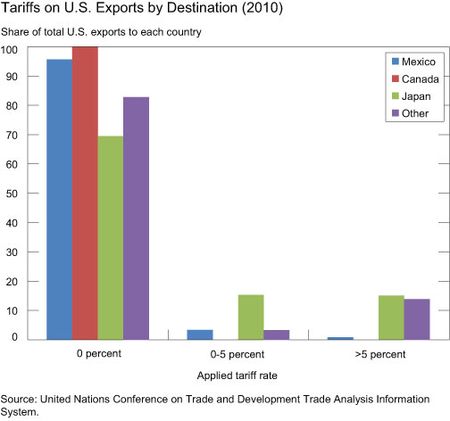
Moreover, the geographic distribution of these tariffs is highly concentrated in non-NAFTA countries, notably Japan. As the chart below shows, roughly 30 percent of U.S. exports to Japan are subject to some nonzero tariff rate, indicating substantial scope for liberalization, particularly in agricultural industries.
This highlights the fact that Japan joining the TPP has the potential to be a game-changer. As noted in a recent study, the estimated gains for the United States are twice as high with Japan in the TPP than not. However, our analysis of the tariff data illustrates that the reports of Japan resisting tariff cuts in exactly these agricultural sectors call into question a large share of the agreement’s purported gains from trade.
Disclaimer
The views expressed in this post are those of the authors and do not necessarily reflect the position of the Federal Reserve Bank of New York or the Federal Reserve System. Any errors or omissions are the responsibility of the authors.

Mary Amiti is an assistant vice president in the New York Fed’s Research and Statistics Group.


 RSS Feed
 Follow Liberty Street Economics