Thomas Klitgaard and Richard Peck
Economists often model inflation as dependent on inflation expectations and the level of economic slack, with changes in expectations or slack leading to changes in the inflation rate. The global slowdown and the subsequent sovereign debt crisis caused the greatest divergence in unemployment rates among euro area member countries since the monetary union was founded in 1999. The pronounced differences in economic performances of euro area countries since 2008 should have led to significant differences in price behavior. That turned out to be the case, with a strong correlation evident between disinflation and labor market deterioration in euro area countries.
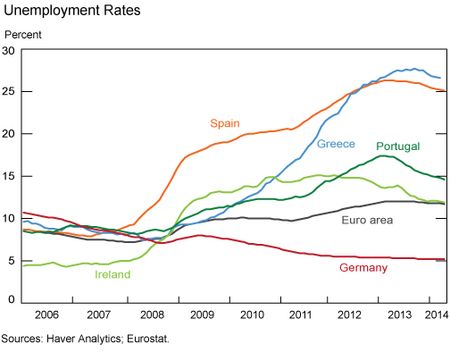
The unemployment rate in the euro area stands at around 11.5 percent, roughly 2.5 percentage points above the average over the euro area’s existence and 4.0 percentage points above the 2007 level. The chart below shows that the labor market deterioration inside the euro area since 2007 has been particularly harsh for the four periphery countries—Greece, Ireland, Portugal, and Spain. Unemployment in Ireland and Spain shot up with the global recession as housing bubbles in those countries burst, while the rates for Greece, Portugal, and Spain, jumped during their sovereign debt crises. Today, unemployment rates in Spain and Greece exceed 25 percent. At the other end of the spectrum, Germany’s unemployment rate barely rose during the global recession and has been trending downward since 2010.
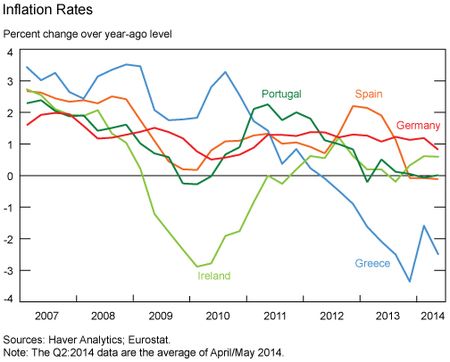
The chart below shows core inflation (which excludes energy, food, alcohol, and tobacco) for the periphery countries and Germany. From 2000 to 2008, the core inflation rates in these countries averaged near 3.0 percent, about 1 percentage point above the average for the euro area as a whole. Inflation rates then declined during the 2008 recession, to near zero for Spain and Portugal, and to deflation in Ireland. Inflation then moved back up in 2010, with the exception of Greece, before finally retreating to near zero or below at the end of 2013.
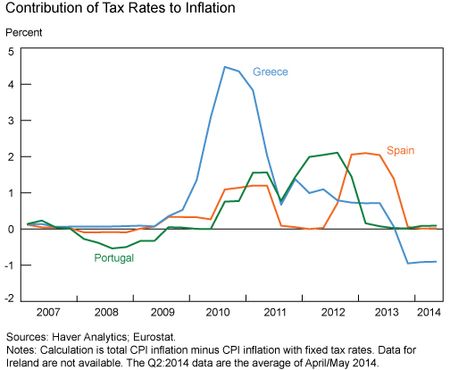
The bump up in inflation would seem surprising given that the euro area experienced a recession from late 2011 to early 2013. The explanation is that the price indexes in the four countries were all pushed higher by increases in value-added tax (VAT) rates as part of their fiscal consolidation efforts during the sovereign debt crisis. The next chart shows the difference between the overall inflation rate (not the core measure) and an official inflation calculation that excludes changes in VAT rates. (Data for Ireland are not available, but the country raised its VAT rate in January 2012.) The impact of taxes on inflation is substantial, distorting any empirical study of inflation dynamics that failed to take taxes into account. Note that the VAT increases stopped boosting inflation rates by the end of 2013, making it more straightforward to measure the degree of disinflation by comparing inflation rates in 2013 with rates in 2007. (Note that the values turn negative for Greece in 2013 as the country cut some VAT rates to support the tourism industry.)
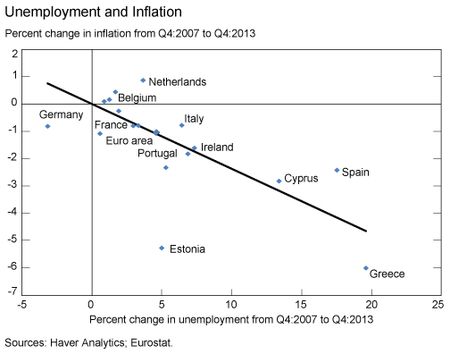
An examination of all euro area member countries shows that changes in core inflation and unemployment rates were indeed correlated over this period. The chart below plots the change in the inflation rate with the increase in the unemployment rate. Specifically, the vertical axis shows the change in the inflation rate between Q4:2007 and Q4:2013. For example, Portugal’s inflation rate fell from 2 percent to no inflation over this period, so it is listed as -2 percentage points. Greece is the extreme case. Core prices in Greece shifted from rising at a 3 percent rate in Q4:2007 to falling 3 percent in Q4:2013, so it has a -6 percentage point reading. The horizontal axis displays the change in the unemployment rate over the same period, with Greece and Spain at the far right. A regression line fitted through the origin has a 10 percentage points increase in unemployment rate correlated with a 2.5 percentage points drop in inflation, with Ireland and Portugal near this ratio. The same is true for the euro area as a whole. Spain and Greece are outliers. Spain had less disinflation relative to the change in its unemployment rate than suggested by the euro area experience during this period, and Greece had more of a response.
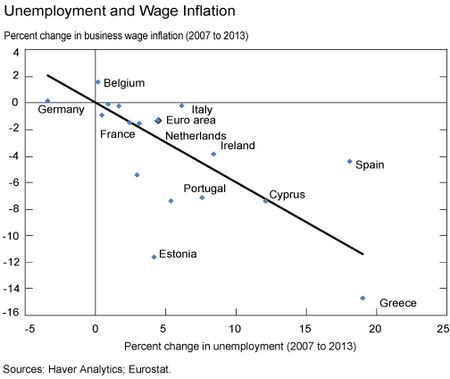
A similar relationship exists for wages. The next chart replaces core inflation with wage inflation in the business sector, with wages measured by average wages and salary per hour. Spain again sticks out with less of a wage inflation response to the jump in the unemployment rate than suggested by the euro area pattern (from +4 to 0 percent), while Greece had a much stronger response (from +4 to -10 percent) to its downturn.
One explanation for the more restrained response of price and wage setting in Spain is that while its unemployment rate spiked along with that of Greece, the Spanish economy was by other measures doing much better. In particular, output in Spain was 6 percent lower in 2013 than it was in 2007 while Greek GDP was down almost 25 percent. An earlier
blog noted that Spain’s unusually steep drop in employment relative to output can be attributed to a flexible labor market that relied heavily on temporary contracts at the onset of the downturn.
Overall, these data show the large drop in periphery inflation from 2007 to 2013 was correlated with increases in economic slack over that period. The core price index is now falling in Greece and the other three periphery countries have core inflation rates near zero. Still, there are signs that a recovery is taking hold in the periphery countries, which will put some upward pressure on inflation rates. How much rates rise, however, will also be dictated by inflation expectations. It is very likely these expectations have been revised down significantly from pre-2008 levels for these four countries, suggesting that the risk of deflation will remain even as labor markets start to improve.
 Thomas Klitgaard is a vice president in the Federal Reserve Bank of New York’s Research and Statistics Group.
Richard Peck is a former senior research analyst in the Group.


 RSS Feed
 Follow Liberty Street Economics