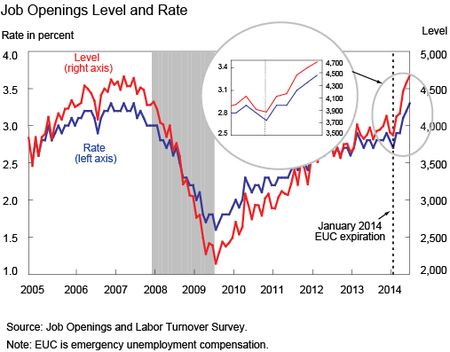
Job openings are arguably one of the most important indicators of recovery in the labor market, as they reflect employers’ willingness to hire. The number of job openings has recovered steadily since the recession, yet through the end of 2013, the openings rate was still substantially below its pre-recession peak (see chart below). Starting in January 2014, however, the number of job openings increased dramatically, up by 20 percent through June 2014, and job openings relative to employment jumped back to the peak of the previous expansion. In this post, we argue that the expiration of the Emergency Unemployment Compensation (EUC) program may have contributed to this rapid rise in 2014.
First enacted in June 2008, the EUC was an important part of the policy response to the Great Recession involving expansion of unemployment insurance benefits (UI). Preexisting legislation provided for up to twenty-six weeks of UI and, in states with a high unemployment rate, the Extended Benefits (EB) program provided twenty additional weeks. EUC started by allowing for an extra thirteen weeks of benefits to all states and was gradually expanded to four tiers, providing up to fifty-three additional weeks of federally financed benefits. This extension increased the maximum duration to an unprecedented ninety-nine weeks. Despite the transitory nature of the program, the EUC was reinstated several times by U.S. Congress, but finally lapsed at the end of 2013. At that time, around 1.3 million unemployed workers lost unemployment benefits, an important source of income (around $300 per week on average).
How can the end of such an important fiscal stimulus, which at face value could be a drag on consumption, help the labor market and boost job openings? After all, one rationale for this program was to provide stimulus to a fragile economy. The mechanism that we offer as an explanation is based on firms’ response to UI and is not new. In fact, the Diamond-Mortensen-Pissarides model (Pissarides 2000, Mortensen and Pissarides 1994, and Diamond 1982), for which the Nobel Prize in Economics was awarded in 2010, predicts that increases in UI generosity put upward pressure on wages since it becomes more expensive to lure people into work. As a consequence, firms anticipate lower profits and cut back job creation, which lowers the job finding rate and increases the unemployment rate.
Most of the previous work on UI has focused on its effect on unemployed workers’ search behavior. Unemployed workers might respond to UI extensions by searching less intensively or by being picky about job opportunities. Several papers have estimated this effect to be small (see, for example, Rothstein [2011], Farber and Valletta [2013], and Valletta [2014]). However, little was known about the effect on job creation, prior to recent work described below.
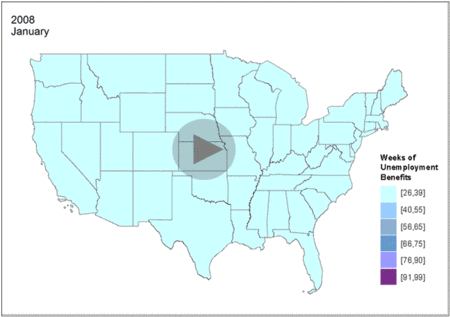
A new staff report by Marcus Hagedorn, Fatih Karahan, Iourii Manovskii, and Kurt Mitman (HKMM) provides empirical evidence that this channel, relating benefits expiration to job creation, might be big. Thanks to the design of the UI system, potential UI durations have evolved quite differently across states. The time-lapse video we created below shows the extent of variation across both time and space. HKMM exploit the variation by comparing the evolution of key labor market variables (such as unemployment, vacancies, and employment) in counties that border each other but belong to different states. Because locations separated by a border are expected to have similar labor markets but differ in policies, this research can provide an estimate of the effects of UI benefit extensions.
Benefits Duration, 2008-13
HKMM’s findings suggest that UI extensions do put upward pressure on wages, reduce job openings, and raise unemployment. How large are the magnitudes? In what follows, we offer estimates of how much the expiration of EUC affected job creation. More specifically, we take the data through January 2014 as given, and predict the evolution of the vacancy rate, assuming that the only change in the economy was the expiration of EUC.
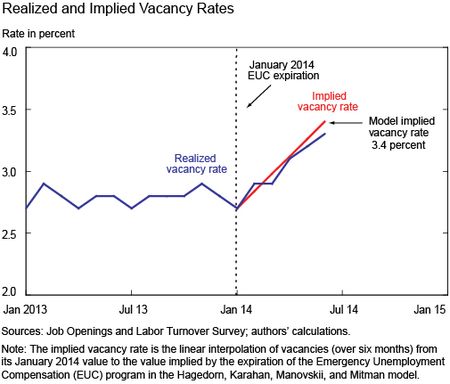
Does the policy change explain the recent spike in job openings? HKMM’s results for the vacancy rate (depicted in the chart below) imply that the EUC expiration raised the job openings rate by 0.6 percentage point to 3.4 percent, remarkably close to the realized rate in the Job Openings and Labor Turnover Survey (JOLTS) report of 3.3 percent for June 2014. Charting the impact of the end of EUC on the vacancy rate over time requires making an assumption about how long the vacancy rate takes to converge to the non-EUC level following the expiration. Usually, vacancies are quick to adjust to changes in the labor market. However, there was uncertainty regarding the expiration of the EUC due to ongoing debates in Congress for reinstatement. Given that prior to its expiration in January 2014, the EUC had lapsed several times but was subsequently reinstated retroactively, we postulate a period of six month for firms to be convinced that the program isn’t coming back. The next chart shows a linear interpolation over six months between the job openings rate in January 2014 and its non-EUC level vis-à-vis the data. Note that in our analysis the expiration of the EUC alone explains quite well the sharp rise in job openings.
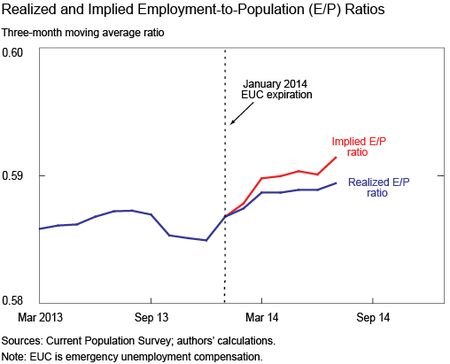
The predictions from the HKMM model for employment are shown in the chart below (see the red line). To make this forecast, we first compute the effect on the job finding rate of the EUC expiration. Then, assuming that it will take six months for the job finding rate to converge to the new level, we simulate labor market variables forward by six months, starting in January 2014 and assuming a constant separation rate fixed at January 2014. The model has the employment-to-population ratio rising in 2014, although at a faster pace than actually occurred. This discrepancy is possibly due to the decline in economic activity in the first quarter that is not accounted for in the simulation.
There are many factors affecting employment, but our analysis suggests that the expiration of the EUC increased the willingness of firms to hire, leading to the large increase in job openings in the first half of 2014.
Disclaimer
The views expressed in this post are those of the authors and do not necessarily reflect the position of the Federal Reserve Bank of New York or the Federal Reserve System. Any errors or omissions are the responsibility of the authors.
Fatih Karahan is an economist in the Federal Reserve Bank of New York’s Research and Statistics Group.
Samuel Kapon is a senior research analyst in the Bank’s Research and Statistics Group.
Kaivan K. Sattar is a senior analyst in the Bank’s Risk Analytics Group.


 RSS Feed
 Follow Liberty Street Economics
….on top of that, long-term unemployment isn’t falling at a faster rate. In fact, the ranks of the long-term unemployed have been falling at a consistent pace for years: New Republic A recent Fed study: ‘Without extended unemployment benefits in late 2013, researchers at the St. Louis Fed found that unemployed workers would have been more likely to find work and on average 1.9 percent less likely to remain unemployed.’ So fewer than 2 in 100 were affected by extending benefits. In the 66 years that the federal government has been keeping employment statistics, there have never been so many people — either as a percentage or just in number — who have been unemployed for so long as in the years since the end of the Great Recession. A report from the Economic Policy Institute released Thursday noted the percentage of unemployed people receiving unemployment insurance benefits has dropped to 25.9 percent, the lowest level since 1987. That translates to about 7.1 million people who are unemployed, but not receiving benefits. Those ranks include people who are long-term unemployed, as well as those who just entered the workforce and would not be eligible for benefits, plus those who quit their jobs and are therefore not eligible. Pittsburgh Post Gazette – Sept 28, 2014 The facts show that a recent 3 month bump in jobs is not the sole reflection of the long-term unemployed no longer receiving extended benefits. I hope you restate your conclusion.
The number of long-term unemployed dropped last month, but there are still 3.1 million people searching for jobs who don’t qualify for insurance. That group represents over 30 percent of the country’s total unemployment rate. And that recent drop in the number of long-term unemployed isn’t entirely good news: many of those stuck without jobs simply give up searching for work and are no longer counted in the government’s statistics. A study by Alan Krueger, a Princeton professor and former member of the Obama administration, found that between 2008 and 2013, just 22 percent of the long-term unemployed had managed to lock down a full-time job, while 35 percent had stopped looking for work. Mother Jones The latest research on this topic from Katharine Bradbury of the Federal Reserve Bank of Boston … finds that unemployment does go up when unemployment benefits are extended, but the question is why. Does it discourage workers from taking jobs, or discourage them from leaving the labor force? Bradbury pointed out that the earlier research shows it’s mostly the latter, that extending unemployment benefits causes workers to stay in the labor force longer before dropping out. No notable impact was found on their willingness to take available jobs. … NY Times
You ‘analysis’ takes into account the last three months of job data. Your vacancy rates started their upward trajectory 3 months AFTER extended benefits expired. How in all honesty can you place so much confidence on three months worth of data? Did you do the same analysis when unemployment was extended during the first GOP recessions of 2001 and 2003? Did you do the same analysis for the extended benefits period during the 1990s? No, apparently not. You put a great deal of weight on a historically short period of time. Also, you do not mention that only about 25% of all unemployed collect benefits, so you ignore the effect of the 75% of unemployed who DID NOT collect benefits. Maybe you can extrapolate this: During the first months of the 2008 recession, jobs were lost at such a rapid rate because unemployment benefits were only 26 weeks? Would you try that approach? No. But you can apply the same approach to few workers and corresponding job ‘creation’ for the past couple months? Did you fail to read this per chance? We now have three months’ worth of job market data since the benefits program expired. There’s been no major shift since the benefits program expired at the end of last year. 538 dot com More on next post.
Saying that ending unemployment benefits creates more jobs (or job openings) is like saying unemployment benefits creates unemployment — which has proved to be NOT TRUE in many studies. Since the Great Recession officially ended in June 2009, we’ve had over 11 million additional working-age people who are “not in the labor force” — many, who are most likely “discouraged workers” who gave up looking for non-existent jobs and are no longer counted as “unemployed”. http://www.bls.gov/webapps/legacy/cpsatab16.htm Also, there are currently over 6.3 million working-age Americans not counted in the unemployment rate (and who are “not in the labor force”) but also want a job — and many are disabled or retired. http://www.bls.gov/web/empsit/cpseea38.htm Of those who retired, about 1.4 million were forced early retirements because they couldn’t find work — most likely, because they’re over 50, employers wouldn’t hire them. http://bud-meyers.blogspot.com/2014/09/forced-retirements-also-drive-declining.html When the Bureau Labor Statistics releases their JOLTS reports, the ratio of job openings is compared to those classified as “unemployed” (and who are still in the labor force) and doesn’t consider “discouraged workers”. In reality, there is most likely only one job opening for every 6 unemployed. And how many of those “job openings” are real? Much has been written about this as well (lots of scams, data collecting, HR and tax accounting fraud, and identity theft). And people who receive unemployment benefits only represent a third of those counted by the BLS as unemployed. And what’s up with this? From MSN Money: “Inflation hawks at the Federal Reserve says inflation is becoming our greatest economic worry. They want the Fed to raise interest rates soon to keep the unemployment rate from dropping too far and to prevent American workers from getting a raise.” http://preview.msn.com/en-us/money/markets/the-fed-would-be-crazy-to-worry-about-runaway-wages/ar-BB5UlrF
What kind of jobs are in the survey data you are using? The results make more sense for minimum or lower wage jobs compeitive with UI, less so to the extent higher wage jobs are included, e,g, are engineering jobs included?