Correction: Earlier, we inadvertently posted the content of the second post in this two-part series under today’s headline. We have updated the blog with the correct content and will post part two on November 12. We apologize for the error.
It’s well known that the Great Recession led to a massive reduction in state government revenues, in spite of the federal government’s attempt to ease budget tightening through American Recovery and Reinvestment Act aid to states. School districts rely heavily on aid from higher levels of government for their funding, and, even with the federal stimulus, total aid to school districts declined sharply in the post-recession years. But the local school budget process gives local residents and school districts a powerful tool to influence school spending. In this post, we summarize our recent study in which we investigate how New York school districts reacted when state aid declined sharply following the recession.
We use school district financial reports and local property tax levy data for New York, one of the many states that cut education funding after the recession. New York is of particular interest because it has the country’s largest school district (New York City) and it contains a range of urban, suburban, and rural districts, across a wide distribution of income levels. Our data set covers 632 school districts from the 2004-05 to the 2011-12 school year. Just before the recession, New York districts received approximately 3 percent of their funding from federal aid, 40 percent from state aid and 57 percent from local revenue. In New York, local revenue is predominantly school district property tax revenue. In contrast, the national averages were 8 percent from federal, 52 percent from state, and 40 percent from local sources.
Using regression analysis, we investigate how school districts reacted to steep declines in state aid per pupil in the post-recession period. The length and details of our district-level panel allow us to control for pre-recession trends, (observable and unobservable) fixed attributes of school districts, and a variety of observable time-varying school district characteristics.
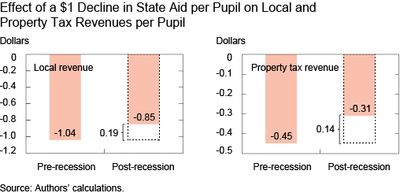
We find that in the pre-recession years, state aid and local funding per pupil had a nearly one-to-one positive relationship in New York: an additional dollar of state aid per pupil corresponded to, roughly, an additional dollar of local funding per pupil; conversely, one less dollar of state aid corresponded to approximately one less dollar of local funding per pupil. In short, these two sources of school district funding moved in tandem. The chart below helps to visualize the relationship. The bar on the left in the first panel shows the pre-recession relationship, when a $1 decline in state aid led to a $1.04 decline in local revenue, $0.45 of which was a decline in property tax revenue. In the post-recession years, the relationship weakened significantly, though it did remain the case that cuts in aid were still associated with cuts in local revenue. In the 2009-12 period, we see that each additional dollar of state aid per pupil lost was met with only a $0.85 decrease in local revenue. In other words, in the post-recession years, local revenue per pupil would still decline as state aid per pupil declined, but it would do so less strongly than it would have before the recession. The right-side bar in each panel displays these results. For local and property tax revenue, we see a $0.19 and $0.14 offset, respectively, relative to the pre-recession relationship. These differences (between pre- and post-recession levels) are highly statistically significant. It seems that local governments responded to cuts in state aid by increasing the local funding effort (relative to the pre-recession relationship), thus weakening the overall negative funding impact on schools that would have occurred had the pre-recession relationship continued in the post-recession years.
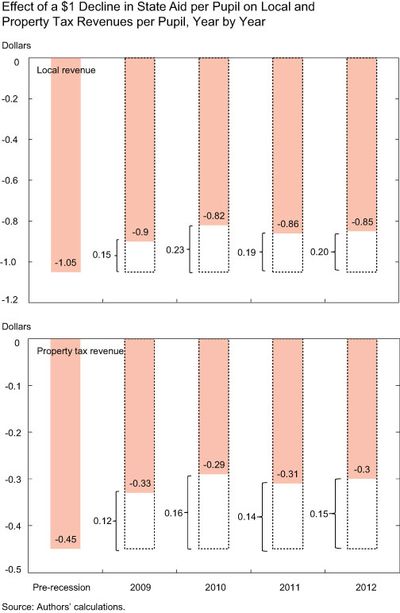
We also investigate whether these patterns persist through the post-recession years or are driven by a single-year effect. The purpose of this analysis is to confirm that a relationship change actually occurred following the recession. To do so, we split the post-recession period into four separate years and observe the relationship between state and local revenue in each of these years (relative to the pre-recession relationship). The chart below shows the results. As before, the left bar in each panel shows the pre-recession relationship; each of the bars to the right shows the individual post-recession year effect. In every year, we see a weakening of the relationship relative to the pre-recession years, indicating that a persistent change did indeed occur. For local revenue per pupil, we see offsetting of $0.15, $0.23, $0.19, and $0.20 in the 2009-12 years, respectively, most of which seem to have come from property taxes. Specifically, for property tax revenue per pupil, the analogous figures are $0.12, $0.16, $0.14, and $0.15.
Our analysis uncovered some interesting patterns. We find that the relationship between state aid per pupil and local revenue (or property tax revenue) changed markedly with the Great Recession, as state aid to public schools declined sharply. Relative to the pre-recession period, a dollar decline in state aid per pupil resulted in a $0.14 increase in property tax revenue and $0.19 increase in local revenue. By allowing the effects of state aid to vary across years, we find that this pattern is not unique to a certain year, but is consistently reflected in each year after the recession. What this amounts to is robust evidence that state aid does affect local budget decision-making—a finding that has important policy implications. The state’s decisions about how much to spend on education during fiscal crises clearly has an effect on not just the state funding itself, but also on local revenue decisions.
Disclaimer
The views expressed in this post are those of the authors and do not necessarily reflect the position of the Federal Reserve Bank of New York or the Federal Reserve System. Any errors or omissions are the responsibility of the authors.

Ravi Bhalla is a senior research analyst in the Federal Reserve Bank of New York’s Research and Statistics Group.

Rajashri Chakrabarti is a senior economist in the Bank’s Research and Statistics Group.


 RSS Feed
 Follow Liberty Street Economics
Thank you for your question. The largest school districts (Buffalo, New York City, Rochester, Syracuse, and Yonkers) do not fund schools directly from property tax revenue; instead the schools are funded as part of the city’s budget (of which property taxes are one component). Because of their different budgetary guidelines and processes, we exclude these five school districts from our analysis. Please see our paper (recently published) for more details: https://aefpweb.org/sites/default/files/edfp_a_00141.pdf The objective of the post is to understand how local funding in a representative school district in New York State responded to state aid changes following the Great Recession.
Thanks for this analysis. My comment is a question: Where is New York City in this data and these charts? Is it excluded? It has about 40% of NY State’s students, so it would be 1 and 3/5ths of the quartiles. If the quartiles are 25% of the 632 districts, reducing NYC (and other large districts) to only one data point, that would distort your results. Pls explain.