It’s natural to think of banks as intermediaries that take in deposits and use them to make loans to businesses and individuals. But in fact, loans make up only 45 percent of the assets of U.S. banking organizations. What’s the rest? A large chunk, representing 24 percent of total assets, is accounted for by securities, such as U.S. Treasury and foreign government bonds, mortgage-backed securities (MBS), municipal and corporate bonds, and equities. In this post, we take a tour of bank securities portfolios, making use of charts and statistics from the Federal Reserve Bank of New York’s report on Quarterly Trends for Consolidated U.S. Banking Organizations. We also discuss reasons why securities represent such a significant part of U.S. banking firm balance sheets.
First, here are some definitions. From an accounting point of view, banks and other corporations classify securities they own into one of three categories:
Trading: Securities that are bought and held principally for the purpose of selling in the near term.
Held to maturity (HTM): Debt securities that the firm has the positive intent and ability to hold until maturity. (Equities can’t be included in this category since they don’t mature.)
Available for sale (AFS): A catch-all for debt and equity securities not captured by either of the above definitions. These are securities that the bank may retain for long periods but that may also be sold.
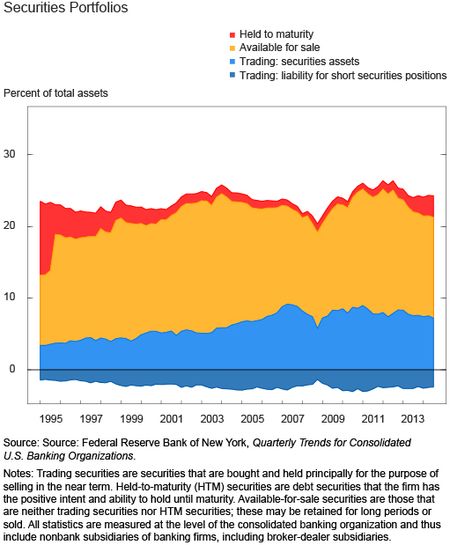
The chart below shows a breakdown of bank debt and equity securities portfolios into these three categories. The size of each portfolio is scaled by the total assets of the commercial banking system.
(Note that, like other figures in the Quarterly Trends report, these statistics are measured at the level of the consolidated banking organization and thus include nonbank subsidiaries of banking firms—in particular broker-dealer subsidiaries, which are active in trading.)
As the chart shows, the prominence of securities in bank balance sheets isn’t a recent phenomenon—it has been a feature of the U.S. banking system for at least the last two decades. Also evident is an increase in debt and equity securities held for trading purposes in the period after the repeal of the Glass-Steagall Act in 1999 (this act had largely separated investment banking and commercial banking up to that point). This upward trend has partially reversed since the 2007-09 financial crisis: trading securities declined from 9.1 percent of total assets in the second quarter of 2007 to 7.2 percent today. This decline would have been larger still except for the conversion of two large trading firms, Goldman Sachs and Morgan Stanley, to bank holding companies in September 2008. (Note: these statistics don’t measure the total size of firm trading portfolios, since we’ve excluded derivatives and loans in order to focus on debt and equity securities portfolios).
Before going further, let’s step back to consider a few reasons why banking firms choose to own securities in addition to or instead of loans.
1. Banks may face an imbalance between their access to deposit finance or other low-cost funding and their profitable lending opportunities. This could be the result of geographic factors, shocks to credit demand or to deposits, or other factors. In such cases, funding-rich banks may choose to invest in securities that reflect lending by other banks or by nonbank lenders (e.g., mortgage-backed securities issued by another lender), or direct debt issuance by nonfinancial firms (e.g., corporate bonds).
2. Relatedly, a bank concerned about liquidity risk may be attracted to securities because of their liquidity; that is, they can be sold more easily and with lower price impact than loans, for which the secondary market is less active. Liquidity concerns may also be driven by regulation—going forward, the liquidity coverage ratio developed as part of the Basel III Capital Accord requires banks to hold enough high-quality liquid assets to meet their liquidity needs under a thirty-day liquidity stress scenario.
3. From a risk management point of view, holding securities may help the bank diversify or mitigate its risk exposures. Conversely, adjusting securities holdings can provide a straightforward way for banks to ramp up their level of risk in an effort to increase expected returns. For example, recent research argues that banks respond to expansionary monetary policy by lengthening the maturity of their securities portfolios, in an effort to boost yields.
4. Holding securities portfolios may help the banking firm perform other financial services. For example, broker-dealers maintain an inventory of securities to allow them to act as market makers, matching buyers and sellers in financial markets and providing liquidity to those markets.
5. In some cases, holding securities instead of loans may be partially or mainly motivated by regulatory arbitrage—helping the firm reduce its capital requirements or provide other types of regulatory relief, perhaps without substantially reducing the overall risk to the firm.
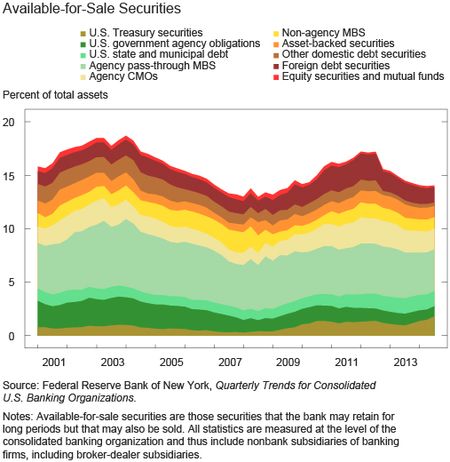
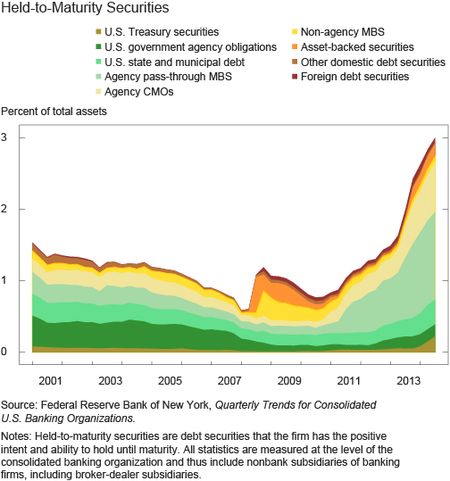
Let’s take a closer look at the composition of bank securities holdings, keeping these different hypotheses in mind. For this exercise, let’s focus on AFS and HTM securities generally intended to be held for investment rather than short-term sale. The next two charts show the allocation of these portfolios across major asset classes. These charts start in 2001, owing to data constraints prior to that year.
The largest category of securities for both portfolio types is agency pass-through MBS. These are pools of securitized mortgages with a credit guarantee from Fannie Mae, Freddie Mac, or Ginnie Mae. Closely related, and also significant in size, are agency collateralized mortgage obligations (CMOs), which are structured securities created from agency mortgage pools.
The importance of agency MBS is consistent with several of the explanations posited above. In line with the risk management explanation, in the agency MBS market it’s common for lenders to engage in “swap transactions” with the government-sponsored enterprises (GSEs) Fannie Mae and Freddie Mac. In such transactions, the bank swaps a pool of conforming mortgages for an MBS pool backed by the same pool of loans but that carries a credit guarantee from the GSE. In so doing, the bank retains the interest rate and prepayment risk of the loan pool but is insulated against credit risk. This type of loan-for-security swap is attractive from the perspective of improving regulatory capital adequacy, since agency MBS carry lower risk weights for regulatory capital purposes than do the underlying mortgages. Furthermore, agency MBS also have relatively little liquidity risk, since their secondary market is large and liquid compared to most loan or fixed-income markets.
In contrast, U.S. Treasuries make up only a relatively small part of AFS and HTM portfolios. One line of academic research argues that banks, because of their access to stable deposit funding, are “patient” investors that have a comparative advantage in holding assets that are higher-yielding but relatively less liquid or that have greater short-run price risk. Although agency MBS are generally liquid, such bonds are riskier than Treasury securities because of their embedded prepayment risk. Thus, the “sticky” nature of deposit finance may help explain banking firms’ preference for agency MBS relative to Treasuries.
Bank holdings also naturally reflect the relative size of different securities markets. For example, bank ownership of non-agency MBS (mortgage bonds issued by private financial institutions rather than the GSEs) increased significantly between 2000 and 2007, alongside the rapid growth in the overall non-agency market, particularly in subprime. Non-agency residential securitization has been low since the financial crisis; correspondingly, bank holdings have shrunk, as the loans underlying old non-agency MBS have defaulted or paid down.
Finally, a notable recent market trend is the shift in bank portfolios toward HTM securities, which although still small, have more than doubled in size as a percentage of banking system assets over the past several years. What explains this trend? A key difference between HTM and AFS is the accounting treatment of gains and losses. As noted in a number of media reports (see one article here), gains and losses in the value of HTM securities that result from movements in market prices (e.g., interest rates) aren’t recognized unless the asset is sold. For AFS securities, however, such shifts in value, while not affecting accounting income, do affect the measurement of regulatory capital adequacy for large banks under the Basel III framework (for so-called “advanced approaches” firms). Correspondingly, increasing the fraction of securities classified as HTM has the capacity to reduce the volatility of regulatory capital ratios but will limit banks’ ability to sell those securities in the future.
Disclaimer
The views expressed in this post are those of the authors and do not necessarily reflect the position of the Federal Reserve Bank of New York or the Federal Reserve System. Any errors or omissions are the responsibility of the authors.
James Vickery is a research officer in the Federal Reserve Bank of New York’s Research and Statistics Group.
Angela Deng is a research analyst in the Group.
Tara Sullivan is a senior research analyst in the Group.


 RSS Feed
 Follow Liberty Street Economics