Student loans have recently attracted a huge amount of attention from the press and policymakers. In this post, the first in our three-part series this week, we’ll use our Consumer Credit Panel dataset, a representative sample drawn from anonymized Equifax credit data, to describe the landscape of the outstanding U.S. student loan portfolio. Much of our discussion will address updates to several graphs that we’ve presented before, most recently in a 2014 staff report, “Measuring Student Debt and Its Performance”; readers can find more detail there. We’ll also update some earlier analysis of the broader effects that student debt may be having on the economy, including data through 2014 on the relationship between student loans and mortgages that we discussed in a blog post last spring.
Before we dive in here, there’s one thing to make clear: a college degree is a worthwhile investment. College graduates earn, on average, 80 percent more than those without a college degree and are also less likely to face unemployment. Economists have shown that even after we control for talent (as more talented people are more likely to attend college), a college degree is still worth it. However, financing a college education is challenging for many families, and student loans remain an important tool.
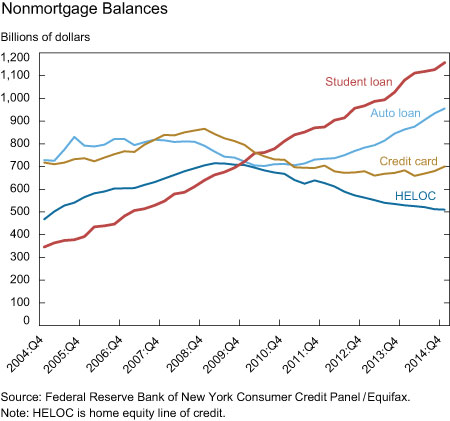
Student debt has had a remarkable trajectory over the past ten years, as seen in the chart below. Until 2009, student loans had been the smallest form of household debt. During the Great Recession, Americans reduced their other debts but continued to borrow for education, making student debt the largest category of household debt outside of mortgages since 2010.
Since 2004, student loan balances have more than tripled, at an average annualized growth rate of about 13 percent per year, to nearly $1.2 trillion, in 2014.
Our data indicate that both increased numbers of borrowers and larger balances per borrower are contributing to the rapid expansion in student loans. Between 2004 and 2014, we saw a 74 percent increase in average balances and a 92 percent increase in the number of borrowers. Now there are 43 million borrowers, up from 42 million borrowers at the end of 2013, with an average balance per borrower of about $27,000.
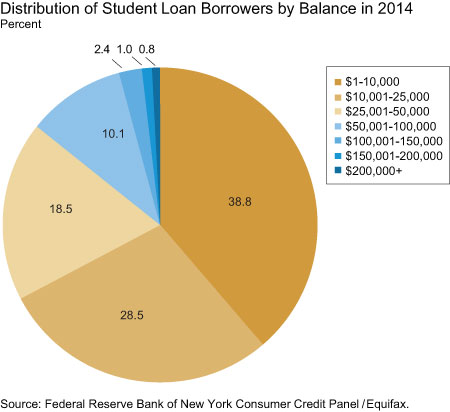
The heterogeneity of borrower indebtedness is very pronounced. As shown in the chart below, nearly 39 percent of borrowers owe less than $10,000, and the median balance is about $14,000. At the high end, more than 4 percent of borrowers, about 1.8 million people, owe more than $100,000.
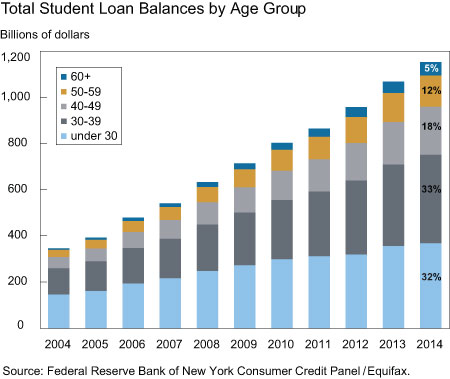
The increase in student debt has happened among borrowers of all ages. The shares of debt have remained relatively stable, with about one third of the debt being held by borrowers in their 20s, one third by borrowers in their 30s, and the final third by those aged 40 or older. About 5 percent of the total balance is held by borrowers aged 60 or older.
Several factors have contributed to the higher inflows of student borrowers and student debt. First, more people are attending college. According to the National Center for Education Statistics, undergraduate enrollment grew 37 percent between 2000 and 2010, and although it dipped slightly in 2012, the trend continues to be up. Second, students are staying in college longer and attending graduate school in greater numbers, since loans to finance graduate study have become more readily available. Third, it has become cheaper for parents to take out student loans to help finance their children’s education. Fourth, the cost of a college education has continued to grow sharply during the period.
In addition to these sources of increased flows of borrowers and balances, the stock of outstanding debt and borrowers is influenced by the slow repayment rate. If borrowers were repaying their debt on schedule, we would see those “successful” borrowers exiting the pool as their balances were paid off. But, as we will discuss in subsequent posts in this series, many borrowers are delaying payments through deferments or forbearances. Increased participation in the Income Based Repayment program and other alternative payment schedules also reduces required payments and lengthens the terms of the loans. Additionally, some borrowers have difficulty making their payments and become delinquent. Many ultimately default, yet continue to have positive loan balances since discharging student debt is very difficult.
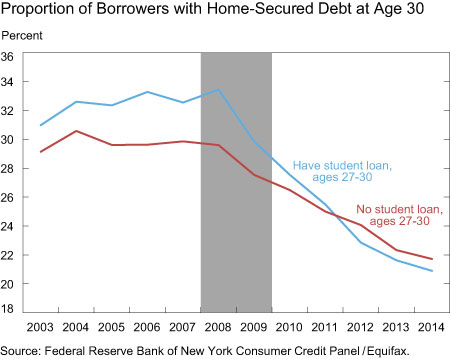
The growth in student debt and especially the changes in student loan repayment rates, delinquencies, and defaults that we’ll document in the next two posts have important consequences for the borrowers and the macroeconomy. One manifestation of these effects is the connection between student debt and homeownership, which we’ve documented before, updated in the chart below. While 30-year-old student borrowers were more likely to have a mortgage prior to the Great Recession, the relationship has essentially disappeared since then: mortgage borrowing has fallen for all 30-year-olds, but has fallen more for student borrowers. The 2014 data, presented for the first time here, confirm that the earlier relationship has not reasserted itself. Additional research, to be released in the near future, strongly suggests that this change is causal: the growth in student debt, with its monthly cost and high delinquency and default rate, seems to be reducing both household formation and homeownership.
One way that student debt can reduce homeownership is through delinquency and default. If large and increasing numbers of student borrowers default on their loans, the resultant damage to their credit ratings would likely preclude home-secured borrowing in the tight lending environment that has prevailed for the last several years. In tomorrow’s post, we present some new measures of delinquency and default that shed new light on this important issue.
Disclaimer
The views expressed in this post are those of the authors and do not necessarily reflect the position of the Federal Reserve Bank of New York or the Federal Reserve System. Any errors or omissions are the responsibility of the authors.

Meta Brown is a senior economist in the Federal Reserve Bank of New York’s Research and Statistics Group.

Andrew F. Haughwout is a senior vice president in the Bank’s Research and Statistics Group.

Donghoon Lee is a research officer in the Bank’s Research and Statistics Group.

Joelle Scally is the administrator of the Center for Microeconomic Data in the Bank’s Research and Statistics Group.

Wilbert van der Klaauw is a senior vice president in the Bank’s Research and Statistics Group.


 RSS Feed
 Follow Liberty Street Economics
It may also be retarding small business formation for the same generation. I would hypothesize that there must also be spillover effects too with older individuals who are co-signing on loans, using home equity loans and reverse mortgages for their children and grandchildren.
I disagree to your assumption that a College degree is worth obtaining in today’s Economy where Wall Street and Corporations have outsourced millions of good paying jobs overseas. The New York Fed should look at the BLS/ St. Louis Office statistics and see that the average college grad has a lesser net worth than the average blue collar worker ten years after graduation and still struggling to pay off their student loan. I find it disingenuous for administrators to push College Education, while at the same time Corporations continue to export huge amounts of jobs overseas to further enhance their executive stock option bonuses, and while Wall Street sends no money in the direction of Capital expansion. I also am convinced that as with all Government subsidized programs such as Medicare, the Government run student loan program is allowing Schools to grossly inflate their costs with little or no public complaint.