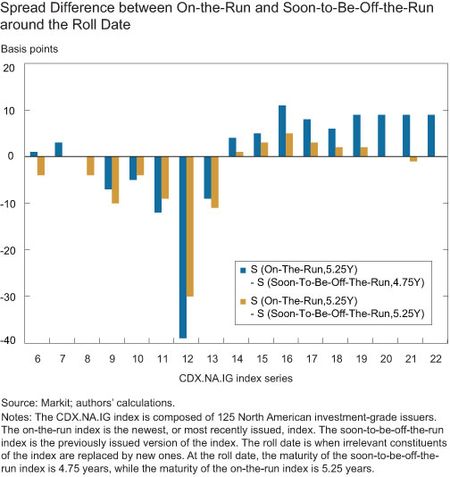
Correction: In the last line of the third paragraph, we mischaracterized a reference to the chart. The difference between the blue and gold bars represents the maturity differential, not the credit quality differential. We regret the error.
Since their inception in 2002, credit default swap (CDS) indexes have gained tremendous popularity and become leading barometers of the credit market. Today, investors who want to hedge credit risk or to speculate can choose from a broad menu of indexes that offer protection against the default of a firm, a European sovereign, or a U.S. municipality, among others. The major CDS indexes in the U.S. are the CDX.NA.IG and the CDX.NA.HY, composed of North American investment-grade (IG) and high-yield (HY) issuers, respectively. In this post, we focus on the CDX.NA.IG index. We discuss the interplay between the index and its constituents, specifically the “roll” process of the index, when irrelevant constituents are replaced by new ones. Analyzing the relation between the CDX.NA.IG index and its constituents in the context of the roll process allows us to gain a better understanding of how the exit of dealers from the single-name CDS market might affect pricing dynamics in the CDS market as a whole.
CDS Index Life-Cycle
CDS indexes are baskets of single-name CDS. By buying protection on the CDX.NA.IG index, the buyer is protected against the default of any of the 125 North American IG issuers included in the portfolio. In exchange for that protection, the buyer makes quarterly payments to the protection seller until the maturity of the contract (or until he or she decides to unwind the position). The composition of the index remains unchanged throughout its lifetime, except when a credit event is triggered for one of the constituents, in which case that constituent is removed from the index without replacement and is settled separately. To maintain a liquid and representative basket, a new composition of the index is introduced every six months. In this roll process, issuers that have become illiquid or below investment grade are replaced by other issuers that satisfy the inclusion criteria. The previous series of the index continues to exist until it matures, so at each point in time multiple series of the index coexist. Nevertheless, liquidity tends to concentrate in the new, or “on-the-run,” series.
Historically, the majority of issuers in the index remain unchanged. Yet the spread of the index “jumps” at the time of the roll. This jump is partially the result of the six months’ maturity extension and partially the result of the credit quality change—in other words, the replacement of issuers. The figure below shows the difference between the on-the-run index and the soon-to-be-off-the-run index. The blue bars indicate the raw difference, and the gold bars represent the difference after extending the soon-to-be-off-the-run index to match the maturity of the on-the-run index. So, the maturity differential is the difference between the blue bars and the gold bars, and the gold bars themselves represent the credit quality differential.

The Relationship between the Index and Its Constituents
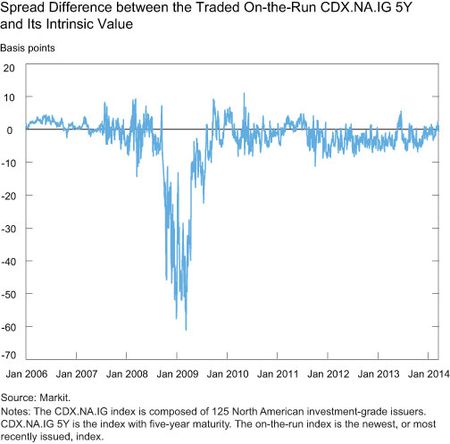
The spread of the CDX.NA.IG index is determined by supply and demand, but the index can also theoretically be replicated by a portfolio of single-name CDS contracts of the individual constituents. Liquidity issues aside, the value of a replicated portfolio will be the duration-weighted average of the constituents’ spreads, which is referred to as the intrinsic value. The difference between the traded spread of the on-the-run CDX.NA.IG index with five-year maturity and its intrinsic value is plotted below. A quick inspection reveals that there is often a spread differential between the intrinsic value of an index and its actual market value, although the basis usually teeters around zero. A notable exception occurred at the height of the financial crisis in 2008-2009, when the difference reached 60 basis points in absolute value. The typically small deviation of the CDX.NA.IG index from its theoretical value, and its subsequent reversion to the parity relation, suggest that there are some forces that keep the index and the single-name contracts in sync. Arbitrageurs who are interested in capturing the pricing differential might be the stabilizing force that holds these two segments of the CDS market in check, though such an arbitrage strategy is very costly to implement and encompasses many challenges (for example, an index/single-name-maturity mismatch, and liquidity).

What Happens to an Issuer That Is Added to the CDX.NA.IG? What Happens if an Issuer Is Dropped?
Theoretically, index inclusion does not reveal new information about the future prospects of the newly included firm, and therefore shouldn’t affect the price of that firm. However, some papers (for example, Harris and Gurel [1986], Shleifer [1986], Denis et al [2003], Chen, Noronha, and Singal [2004], and Wurgler and Zhuravskaya [2002]) have found that inclusion in an equity index is associated with improved stock price performance for the entering firm. The effect of an exclusion from an equity index is found to be negative, but transitory, in some papers, and insignificant in others. The positive impact of inclusion can be explained by, among other hypotheses, increased monitoring of management by investors once the firm is added to the index, which then leads to a greater effort by management; price pressure owing to higher demand from funds that track the index; or greater reputation cost if management were to perform poorly. We test these effects of inclusion and exclusion in the context of the CDX.NA.IG index and see if such results carry over, keeping in mind that trading CDS contracts serves a different function than trading equities.
To quantify the impact on a firm’s credit risk of entering the index, we use the single-name abnormal CDS spread changes for the constituents that were added. Since we are interested in isolating the “index effect,” we focus on firms that are added to the index for the first time, and we exclude from the sample those issuers that are removed from the CDX.NA.IG index but then immediately added to a different index, such as the CDX.NA.HY. In our empirical analysis, we find that the cumulative abnormal spread of an issuer that is entering the CDX.NA.IG index is 12 basis points in the seven business days following the inclusion. In other words, the spread of an entrant increases more than it would if it weren’t entering the index, implying that the market associates a higher risk with a firm after it enters the index. We repeat the analysis for firms that exit the index. Exit in this context means that the firm is in the soon-to-be-off-the-run series but not in the new on-the-run series, and the reason for its exclusion is liquidity related, not credit related. For issuers that exit the CDX.NA.IG, we do not find a statistically significant reaction. The lack of impact for a firm that is excluded from the CDX index seems to be related to the fact that a name does not completely “exit” an index, and continues to exist in previous series of the index.
Conclusion
We find that entering the CDX index translates to a spread increase of the underlying single-name CDS. This is an important result when evaluating the stability of these markets, which are adjusting to new regulation (Dodd-Frank, the Volcker Rule, and the Basel III Accord). Over the past several years, single-name CDS trading activity has declined while CDS indexes trading activity remained stable. If, indeed, trading activity in the index affects the prices of its constituents and t
heir trading activity, this asynchronous trading activity in the single-name CDS and the index might manifest itself in asynchronous pricing owing to the inability of arbitrageurs to trade in both markets. Such price divergence might intensify if more market participants were to exit the market—potentially reducing the usefulness of the CDS market for monitoring credit risk and hedging purposes—and should therefore be closely tracked.
Disclaimer
The views expressed in this post are those of the authors and do not necessarily reflect the position of the Federal Reserve Bank of New York or the Federal Reserve System. Any errors or omissions are the responsibility of the authors.
Jennie Bai is a former economist in the Federal Reserve Bank of New York’s Research and Statistics Group, and is currently an assistant professor at Georgetown University.

Or Shachar is an economist in the Group.


 RSS Feed
 Follow Liberty Street Economics
Joe McHugh, thank you for your comment. We appreciate your readership. The reference to the chart has been updated.
The bias in selecting new index constituents is toward credits that are “tradable,” the CDS market’s euphemism for having blow up risk. Why do you think First Data (FDC) was added to the index only a few weeks before it was LBOed? As for your decomposition of on/off the run spreads, don’t the gold bars represent credit quality differences, since you have already adjusted for maturity mismatches? And the gold/blue spread the curve differences?