There are various types of economic forecasts, such as judgmental forecasts or model-based forecasts. In this post, we provide an update of the economic forecasts implied by the Federal Reserve Bank of New York’s (FRBNY) dynamic stochastic general equilibrium (DSGE) model, which we introduced in a series of five blog posts in September 2014 here. It continues to predict a gradual recovery in economic activity with a progressive but slow return of inflation toward the Federal Open Market Committee’s (FOMC) long-run target of 2 percent. This forecast remains surrounded by significant uncertainty. Please note that the DSGE model forecasts are not the official New York Fed staff forecasts, but only an input to the overall forecasting process at the Bank.
As discussed in the earlier series, the FRBNY DSGE model is a macroeconomic model based on modern economic theory, which characterizes the equilibrium evolution of key macroeconomic variables and identifies the underlying shocks that perturb the economy. This model is estimated using Bayesian statistical techniques, which combine prior information on model parameters with a range of data series. The DSGE model is a work in progress. We continuously strive to improve it, and augment it, so that it can provide information about a growing set of economic variables. Accordingly, the forecasts presented here are obtained using a new version of the FRBNY DSGE model discussed in September. (Find the code used for estimating the new model here.)
This version builds on the New Keynesian model with financial frictions used in Del Negro, Giannoni, and Schorfheide (2015), which has been shown to provide a reasonable explanation for the behavior of inflation in the aftermath of the Great Recession, and relatively accurate forecasts of output growth and inflation throughout recent history (see this post and this chapter in the Handbook of Economic Forecasting). Relative to the previous version of the FRBNY DSGE model, the set of observable indicators is augmented with data on consumption and investment growth, survey-based long-run inflation expectations, which provide information on the public’s perception of the central bank’s inflation objective, and the ten-year Treasury yield, in order to incorporate information about long-term rates. In addition, the model is estimated using two distinct measures of inflation—the GDP deflator and core personal consumption expenditures (PCE) inflation. Finally, the model allows for persistent shocks to both the level and the growth rate of productivity (where the latter shocks account for the possibility of secular stagnation), and uses data on the growth rate of productivity from the San Francisco Fed in order to inform these processes.
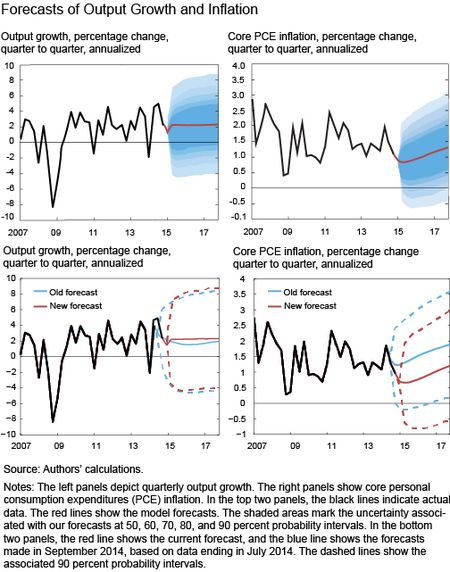
The top panel in the chart below presents quarterly forecasts for real output growth and the core PCE inflation rate over the 2014-17 horizon. These forecasts were produced on April 9 using data released through 2014:Q4, augmented for 2015:Q1 with a “nowcast” for GDP growth, core PCE inflation, and growth in total hours, and 2015:Q1 observations for financial variables. The reason for using nowcasts is that the model is estimated on National Income and Product Accounts data, which are only available with a lag. Nowcasts incorporate up-to-date information, and this tends to improve short-run forecasts, as shown here. The black line represents released data, the red line is the forecast, and the shaded areas mark the uncertainty associated with our forecasts at 50, 60, 70, 80, and 90 percent probability intervals. Output growth and inflation are expressed in quarter-to-quarter percentage annualized rates.

The FRBNY DSGE forecast for output growth is slightly stronger than it was in our earlier blog post which used data ending in July 2014. This difference is highlighted in the bottom left panel of the chart, which compares current (solid line) and September (dashed line) forecasts. The model projects the economy to grow 1.9 percent in 2015 (Q4/Q4), 2.1 percent in 2016 and 2.2 percent in 2017. The headwinds that slowed down the economy in the aftermath of the financial crisis are finally abating. This is reflected in the model-implied “natural” level of output and the “natural” rate of interest, which are defined as the counterfactual level of output and interest rate that would obtain in an ideal economy where nominal rigidities, markup (or cost-push) shocks, and financial frictions are absent. Estimates of the recent natural level of output show a more rapid growth as the headwinds facing the economy are fading. As we will discuss at length in our next post, the natural rate of interest is finally increasing toward positive ranges, after having been negative for the entire post-Great Recession period.
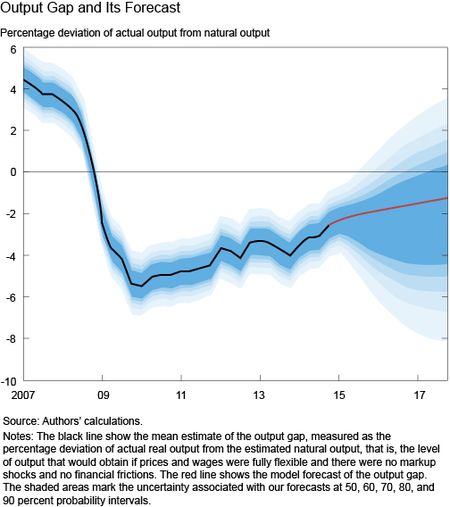
The recovery has been relatively slow, however, with economic activity remaining below its natural level since the end of 2008 and projected to remain so throughout the forecast horizon. The model thus predicts a very gradual closing of the output gap, measured as the percentage deviation of actual output from natural output (although there is much uncertainty about the gap forecast). This output gap, along with its forecast, is shown in the next chart.

This chart suggests that there is slack—that is, underutilized capacity—in the economy. The slack also reflects low marginal costs of production for firms—a key driver of the inflation projections. The model’s estimate of firms’ marginal costs suggests that these have not recovered much over the last few years due to the weakness in real wage growth. As a consequence, inflation projections are weak, with core PCE inflation expected to remain below 1.5 percent until the end of 2017. Note that increases in future real wages and marginal costs, far from being a warning sign of impending inflationary pressures, are actually a necessary condition for this (albeit slow) convergence of inflation towards the FOMC long-run objective. In the absence of accelerating wages, inflation projections would be even weaker.
The change in inflation forecasts relative to those in our previous post reflects weaker than expected incoming inflation data since last year, caused by the rapidly declining oil prices and switch to the new version of the model. In terms of inflation forecasts, the new model differs from the previous one in two dimensions. First, it features more persistence in inflation, which is largely endogenous and due to the output gap closing very gradually. Second, it features more persistent markup shocks. This is because markup shocks no longer have to capture the substantial high frequency noise in quarterly core inflation, given that inflation is measured as the common factor between core PCE inflation and the GDP deflator. In terms of the current forecast, this implies that markup shocks, which capture declines in oil prices, have a relatively prolonged effect on inflation.
Uncertainty around the forecasts is significant, particularly for GDP growth. The width of the 68 percent probability interval for GDP growth is 3.8 percentage points in 2015 and widens to 5.3 percentage points in 2017. The 68 percent probability intervals for inflation remain relatively tight, ranging from 0.4 percent to 1.3 percent in 2015 and from 0.4 percent to 2.1 percent in 2017.
Market participants’ expectations about monetary policy are a key determinant of the model’s forecast as they affect the evolution of long-term interest rates. In order to capture the effects of forward guidance, or more generally of the Fed’s communication, the forecast is conditioned on financial market expectations of the path of the federal funds rate through 2015:Q2. After this quarter, we let the model set the path of the policy rate according to the “historical” interest rate rule, the one that we estimated over the pre-zero-lower-bound period. Under the current forecast, the model predicts the federal funds rate to return slowly to its long-run level.
In conclusion, the FRBNY DSGE model continues to predict a gradual recovery in economic activity with a slow return of inflation toward the FOMC’s long-run target of 2 percent, as the negative effect of the Great Recession dissipates. This forecast remains surrounded by significant uncertainty, with the risks slightly skewed to the downside for output growth because of the constraint on policy imposed by the zero lower bound.
Disclaimer
The views expressed in this post are those of the author and do not necessarily reflect the position of the Federal Reserve Bank of New York or the Federal Reserve System. Any errors or omissions are the responsibility of the author.
 Marco Del Negro is an assistant vice president in the Federal Reserve Bank of New York’s Research and Statistics Group.
 Marc Giannoni is an assistant vice president in the Group.
Matthew Cocci is a senior research analyst in the Group.
Sara Shahanaghi is a senior research analyst in the Group.
Micah Smith is a senior research analyst in the Group.


 RSS Feed
 Follow Liberty Street Economics