Our Consumer Credit Panel, which is based on data from the Equifax credit reporting agency, first arrived at the New York Fed in 2009, and our very first Quarterly Report on Household Debt and Credit was published in August 2010, five years ago this month. We’ve continued to produce the same report, with very few changes, since the report’s initial release. However, with today’s release of the report for the second quarter of 2015, we’re beginning to make some changes, starting with two new charts that provide granularity on mortgage loan originations. These data are identical to the originations data that we’ve released previously, but we now report origination volume by credit score groups. The new charts’ form will be familiar to those who have seen our earlier work on auto loans or the U.S. Economy in a Snapshot, and will leverage some of the detail that we have in our dataset on new extensions of credit and underwriting standards.
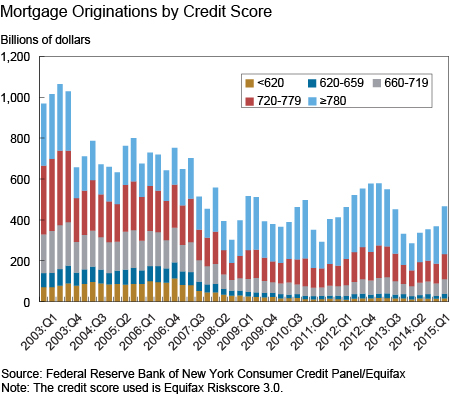
Our first new chart, showing the breakout of mortgage originations by credit score, appears below. What is most striking is the post-2006 trend toward lower mortgage origination volume. Overall mortgage lending fell sharply during the financial crisis and, aside from a brief refinancing boom in 2012-13, has not recovered to pre-crisis levels. For example, new originations were $1.3 trillion in 2014, compared with $2.9 trillion in 2005.

Overall, originations picked up in the second quarter of 2015 and have been rising over the last year. However, as the chart makes clear, this new mortgage borrowing has been driven by borrowers with credit scores above 660. Originations by borrowers with credit scores below 660, shown in dark blue and yellow, fell sharply after the Great Recession and have not recovered. Originations to borrowers with these low scores exceeded $650 billion in 2006, but have remained below $150 billion since 2010 as subprime mortgage lending has all but dried up.
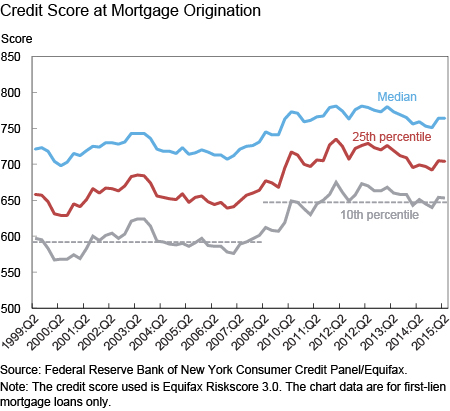
The second chart we are adding shows the distribution of credit scores of newly originated first-lien mortgage loans.

Underwriting standards for mortgages have loosened only slightly in the years since the Great Recession. The median credit score at origination hovered around 720 between 1999 and 2007 (with an average of 719); the median credit score of mortgage originators during and after the Great Recession has been 765. The 10th percentile line, in grey in the chart above, shows that the subprime borrowers have been all but precluded from originating. Between 1999 and 2007, 90 percent of borrowers who originated mortgages had credit scores above 590; between 2008 and 2015, 90 percent of borrowers had credit scores above 645, representing a 55-point upward shift of the distribution.
These charts will now be part of our Quarterly Report on Household Debt and Credit; the underlying data will be made available in our spreadsheet and the data from 1999 to 2003 will also be posted in our historical file. Stay tuned for additional changes to our report in coming quarters!
Disclaimer
The views expressed in this post are those of the author and do not necessarily reflect the position of the Federal Reserve Bank of New York or the Federal Reserve System. Any errors or omissions are the responsibility of the author.
 Andrew Haughwout is a senior vice president in the Federal Reserve Bank of New York’s Research and Statistics Group.
 Donghoon Lee is a research officer in the Bank’s Research and Statistics Group.
 Joelle Scally is the administrator of the Center for Microeconomic Data in the Bank’s Research and Statistics Group.
 Wilbert van der Klaauw is a senior vice president in the Bank’s Research and Statistics Group.


 RSS Feed
 Follow Liberty Street Economics