The aftermath of the financial crisis and changes in technology and regulation have spurred a spirited discussion of dealers’ evolving role in financial markets. One such role is to buy securities at auction and sell them off to investors over time. We assess this function using data on primary dealers’ positions in benchmark Treasury securities, released by the New York Fed since April 2013 and described in this earlier Liberty Street Economics post.
Auctions affect dealers’ positions
Past work has highlighted the importance of the auction cycle in explaining dealers’ positions. Primary dealers are expected to participate in auctions of government debt, and are the predominant purchasers of securities at auction, as discussed in this article in our Current Issues series. A later New York Fed staff report shows the importance of auctions in explaining dealers’ net Treasury bill or coupon security position changes over time across broad categories of securities (for example, all Treasury bills as a group) in the precrisis period, with positions increasing in the weeks including auctions and decreasing in adjacent weeks.
Evolving Role of Dealers
We revisit how auctions affect dealers’ positions here, but for a postcrisis sample period and using more granular data. A past post shows that dealers’ share of purchases at auction has been declining over time. More generally, dealer assets declined sharply during the crisis and have since stagnated, as discussed in this post. Even if dealers are still active purchasers of securities at auction, the extent to which they hold these positions, rather than immediately sell them to other investors, is an open question.
Granular data allow finer analysis of dealers’ positions
While earlier work had to rely on data aggregated across broad buckets of securities, the release of specific issue data allows for a finer analysis. In particular, the New York Fed has been publishing data on dealers’ positions in the most recently issued (or benchmark) coupon securities of a given maturity since April 2013. The data are reported as of the week ending Wednesday, and are aggregated across all dealers. This post focuses on dealers’ net positions, but specific issue data on trading volume, financing activities, and settlement fails are also made public.
Dealers’ Positions in Benchmark Coupons
Dealers in aggregate tend to be net short the benchmark coupon securities. That is, their short positions in the securities generally exceed their long positions. This is because dealers use the benchmark securities to hedge their positions in other securities. For example, dealers often underwrite corporate debt issuance, requiring them to take on long corporate debt positions, and they often hedge the associated interest rate risk by shorting benchmark Treasuries.
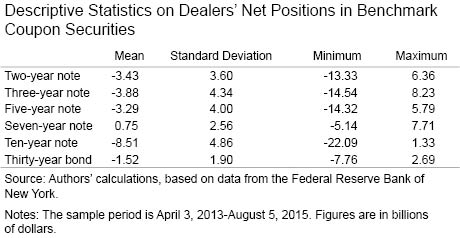
The following table shows that dealers’ net positions in five of the six benchmark coupons have been negative (that is, short), on average, since April 2013. Positions in the ten-year note have been mostly negative, averaging -$8.5 billion, but occasionally positive. Positions in the seven-year note have generally been positive, averaging $0.7 billion, but sometimes negative.
Dealers’ Positions in Other Coupons
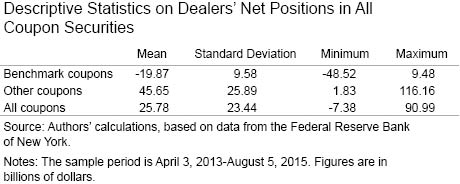
Dealers’ positioning in benchmark securities differs markedly from that seen in other securities. While dealers have been almost always net short the benchmark coupons since data have been released, they have been continually net long nonbenchmark coupons, as shown in the table below. The dealers likely maintain net long positions in the other coupons for market-making or speculative purposes, and likely hedge such positions with benchmark coupons.
Dealers’ Positions and Cyclicality
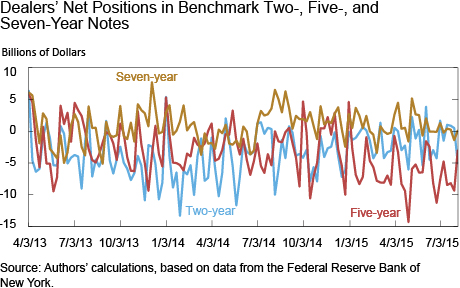
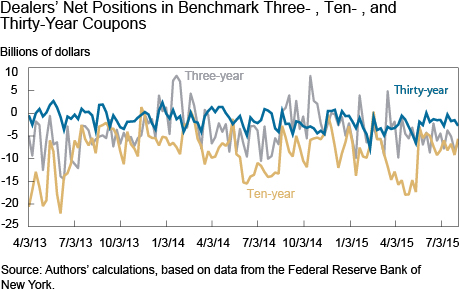
We next consider whether dealers’ positions in the six benchmark coupon securities change over time, and if so, how. The chart immediately below plots positions in the three notes issued around the turn of the month and the subsequent chart plots positions in the three securities issued around the middle of the month. A notable feature of the positions is an apparent cyclicality at roughly a one-month horizon.
Cyclicality of Positions and Auctions
We know from past work using aggregated data that dealers’ positions tend to increase in auction weeks and decrease in adjacent weeks. Moreover, all of the benchmark coupon securities have been sold on a monthly basis in recent years. It thus seems reasonable to assume that the monthly auctions may be behind the cyclicality in positions noted above. In fact, dealers’ aggregate net positions tend to be highest in the first week in which data are collected for a particular benchmark security, and decline in subsequent weeks, as shown in the chart below.
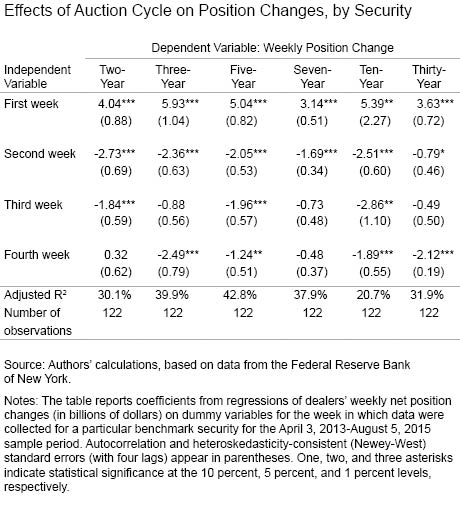
We next use regression analysis to formally examine the relationship between the auction cycle and dealers’ positions. Specifically, we regress week-to-week changes in dealers’ net positions in the benchmark coupons on dummy variables for the first, second, third, and fourth weeks in which data were collected for a benchmark security. For the first week, the position change is relative to the previously issued security of the same original maturity.
Our results, shown in the table below, confirm that the auction cycle is important to explaining dealers’ net positions in the benchmark coupons. As of the first Wednesday after a security’s issuance, dealers’ net positions in the benchmark securities increase a statistically significant $3.1 billion (for seven-year notes) to $5.9 billion (for three-year notes), depending on the security, relative to their positions in the old benchmark securities the previous Wednesday. In subsequent weeks, dealers’ net positions decline, and by a cumulative amount over the subsequent three weeks that is roughly similar to the increase seen in the first week.
Aside from statistical significance, the high adjusted R2s of the regressions, ranging from 21 percent for the ten-year note to 43 percent for the five-year note, indicate that much of the variation in dealers’ positions in the benchmark issues can be explained by the auction cycle alone.
In Sum
Dealers continue to be the leading underwriters of Treasury auctions despite their declining share of purchases in recent years. We find that such purchases leave a distinct mark on their holdings of the benchmark coupon securities, with positions increasing in the week of issuance and decreasing in subsequent weeks. The results suggest that dealers continue to play an important role in the intertemporal intermediation of Treasury supply, buying securities at auction and selling them off to investors in subsequent weeks.
Disclaimer
The views expressed in this post are those of the authors and do not necessarily reflect the position of the Federal Reserve Bank of New York or the Federal Reserve System. Any errors or omissions are the responsibility of the authors.
 Michael J. Fleming is a vice president in the Federal Reserve Bank of New York’s Research and Statistics Group.
Collin Jones, a former undergraduate intern at the Bank, is a student at William & Mary.


 RSS Feed
 Follow Liberty Street Economics