Market participants have argued that market liquidity has deteriorated since the financial crisis. However, inspection of common metrics such as bid-ask spreads, market depth, and price impact do not show pronounced reductions in liquidity compared with precrisis levels. In this post, we argue that recent changes in liquidity conditions may best be described in terms of heightened liquidity risk, as opposed to general declines in liquidity levels. We propose a measure that shows liquidity risk has risen in equity and Treasury markets and discuss some factors behind the increase.
Market liquidity appears ample
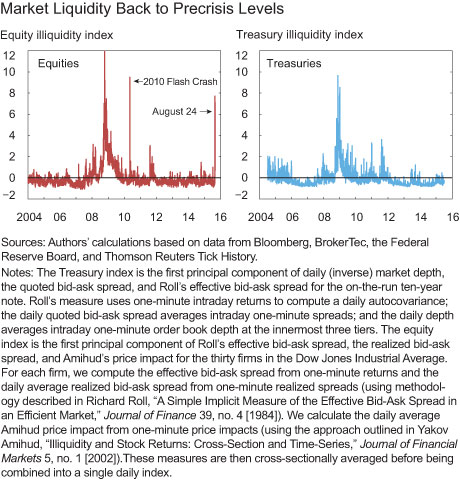
Analysts have expressed concern that market liquidity has suffered in recent years. However, direct evidence of deterioration in market liquidity is hard to obtain. By most measures, Treasury and stock market liquidity have returned to precrisis levels, as summarized in the chart below (and shown in more detail in an earlier post, “Has U.S. Treasury Market Liquidity Deteriorated?”).

But liquidity risk has risen
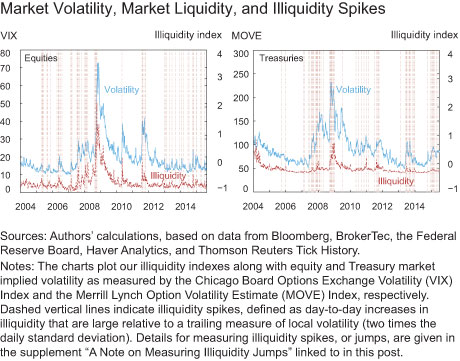
While current levels of liquidity appear similar to those observed before the crisis, sudden spikes in illiquidity—like the equity market flash crash of 2010, the recent equity market volatility on August 24, and the flash rally in Treasury yields on October 15, 2014—seem to have become more common. Such spikes in illiquidity tend to coincide with spikes in option-implied volatility, in both equity and Treasury markets, as shown in the next chart.

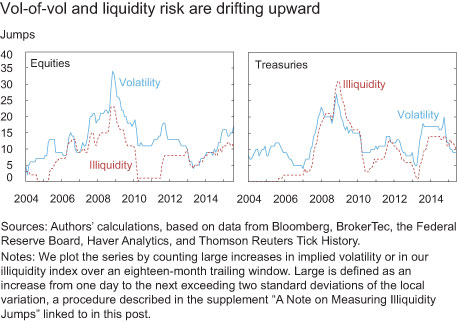
Another way to picture these dynamics is to plot the frequency of large jumps in liquidity and volatility over time, where “large” is defined relative to measures of recent volatility and liquidity. (Details for measuring jumps in illiquidity are provided in this supplement.) Following our earlier post “Has U.S. Corporate Bond Market Liquidity Deteriorated?,” we refer to these liquidity jumps as “liquidity risk” and volatility jumps as “vol-of-vol.” Counting the number of such jumps in an eighteen-month trailing window reveals a recent uptick in liquidity risk and vol-of-vol, and confirms the link between them (see the chart below). The evidence that liquidity risk in equities and Treasuries is elevated contrasts with our earlier post, which found no such increase for corporate bonds.

Potential Drivers of Increased Liquidity Risk in Equities and Treasuries
Market analysts frequently argue that regulatory changes since the crisis have led to a deterioration in market liquidity. Their argument is that the new regulations that forced dealers to be better capitalized and to manage risk more prudently have increased the cost of market making. Our findings, however, seem to contradict this potential driver of liquidity risk. If new regulations were to blame, then we would expect corporate bonds to show significantly increased liquidity risk, since corporate bond markets are heavily dealer-intermediated and are relatively more balance sheet intensive.
Instead, the seeming increase in liquidity risk for equities and Treasuries (but not corporate bonds) points toward changes in market structure. In particular, a distinguishing feature of trading in equities and on-the-run Treasuries versus trading in corporate bonds is that the former is largely electronic, with significant trading occurring at high frequencies. Furthermore, a growing share of liquidity provision in these markets is conducted by nondealer entities like principal trading firms and hedge funds (see the earlier post on the events of October 15). While bid-ask spreads and other costs of trading in equities and Treasuries have come down markedly as a result of this increased competition, these changes may have come at the cost of heightened liquidity risk, or sudden withdrawals of liquidity provision.
In contrast, significant amounts of trading in corporate bonds are through dealers and conducted over the phone or through request-for-quote systems. In the absence of competition from nondealer liquidity providers, this form of market making is more expensive in terms of higher bid-ask spreads and longer execution times. However, these costs may be offset by a more stable liquidity risk profile.
In sum, we conjecture a trade-off between liquidity levels and liquidity risk. While competitive entry in the liquidity provision business for equities and on-the-run Treasuries has resulted in dramatic improvements in the level of liquidity, we document a simultaneous increase in estimated liquidity risk. In contrast, in the relatively less competitive corporate bond intermediation business, a stable liquidity risk profile may come at the cost of a market that, though extremely liquid by historical standards, is illiquid compared to the equities and on-the-run Treasury markets.
Are market participants concerned about Treasury and equity liquidity risk?
The link between liquidity risk and vol-of-vol suggests that concerned investors can hedge liquidity risks by buying volatility insurance in the option market. That is, if liquidity risk were of sufficient concern, then market participants could buy options that pay off during such episodes. Sellers of such options would command a risk premium for being net short volatility.
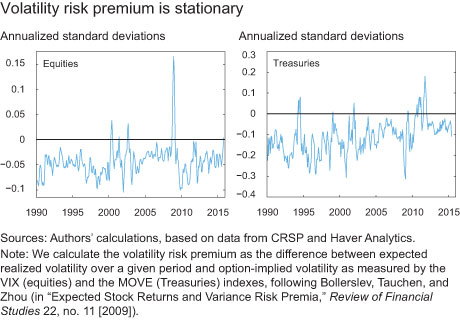
We measure the volatility risk premium as the difference between realized volatility and option-implied volatility. This difference reflects a form of insurance, since it is positive when realized volatility exceeds the price of volatility. (Providing insurance is risky, so the volatility risk premium is negative, on average.) The next chart shows that the volatility risk premium has not trended downward, implying that the price of volatility risk has not increased. In fact, the volatility risk premium appears to have become less negative for Treasuries, so that the price of volatility risk has seemingly declined. Thus, if market participants are concerned about heightened liquidity risk in equities and Treasuries, it is not showing in the associated options markets.

In Sum
Our findings suggest a trade-off between liquidity levels and liquidity risk: while equity and Treasury markets have been highly liquid in recent years, liquidity risk appears elevated. This change has gone hand in hand with an apparent increase in the vol-of-vol of asset prices, so that illiquidity spikes seem to coincide with volatility spikes. Our findings further suggest that the increase in liquidity risk is more likely attributable to changes in market structure and competition than dealer balance sheet regulations, since the latter would also have caused corporate bond liquidity risk to rise. Moreover, evidence from option markets suggests that this seeming rise in liquidity risk is not reflected in the price of volatility.
Disclaimer
The views expressed in this post are those of the authors and do not necessarily reflect the position of the Federal Reserve Bank of New York or the Federal Reserve System. Any errors or omissions are the responsibility of the authors.

Tobias Adrian is the associate director of research and a senior vice president in the Federal Reserve Bank of New York’s Research and Statistics Group.

Michael J. Fleming is a vice president in the Bank’s Research and Statistics Group.

Daniel Stackman is a Research Associate in the Bank’s Research and Statistics Group.

Erik Vogt is an economist in the Bank’s Research and Statistics Group.


 RSS Feed
 Follow Liberty Street Economics
Ken, Thank you for your comments. We don’t disagree with the TMPG meeting minutes. A key point in our blog posts is that multiple factors, including dealer balance sheet and risk management changes (emanating from the crisis and regulatory changes), as well as changes in market structure (including the continued growth of high- frequency trading), are likely affecting market participant behavior. Empirically, however, it is difficult to identify regulation’s effects on market liquidity. We also agree with your points about the many differences between the Treasury and corporate debt markets. Our point is that such differences may explain the apparent divergences in the evolution of liquidity risk. It’s notable that despite the differences you identify, the levels of the Treasury, corporate, and equity liquidity indices exhibit broadly similar behavior (suggesting that there are some common drivers).
Re: Driver of liquidity risk. From TMPG meeting minutes 10/16/14: “Possible drivers discussed included large scale repositioning by leveraged investors, activities of electronic trading algorithms, and dealer balance sheet and risk management constraints.” meeting minutes 11/19/14: “Some members also suggested that regulatory changes over the last couple of years may have resulted in a reduced ability or willingness by dealers to assume proprietary positions or to intermediate large positions particularly in volatile periods.” Regulatory change was also cited at the 2/16/15 and 6/24/15 meetings. So its not just market analysts. Lastly the blog draws a spurious correlation between Treasury and corporate bond liquidity because of the different way each product trades, the data available, the participants and the size of each market.
Francesco, thank you for your comment. In fact, severe liquidity events can cause the VIX to increase significantly intraday and remain elevated long enough for an option hedge to be viable. For example, during the May 2010 Flash Crash, the VIX opened at about 24, breached 40 during the liquidity event, and remained elevated until closing at about 33. Even though the VIX itself is not tradeable, positive vega positions in options (i.e., those that are long volatility) would have yielded a positive return over the day and would have therefore presented possible hedges to non-HFT market participants. Also, note that the maturity of the option (thirty days in the case of the VIX) plays less of a role than it might seem at first glance: the S&P 500 index option surface, for example, has a strong factor structure, meaning that the first principal component of all implied volatilities in strike and maturity space (a “level factor”) accounts for most of the time series variation in the option surface, and will look very much like the VIX (similar to how the ten-year Treasury yield correlates strongly with the first principal component of the yield curve).
Maybe options don’t give the right type of insurance against flash crashes: a 30 days VIX can hardly hedge market participants against events that last few seconds.