Commentators have argued that market liquidity has deteriorated in recent years as regulatory changes have reduced banks’ ability and willingness to make markets. In the corporate debt market, dealer positions, which are considered essential to good liquidity, have indeed declined, even as issuance and outstanding debt have increased. But is there evidence of reduced market liquidity? In previous posts, we discussed these issues in the context of the U.S. Treasury securities market. In this post, we focus on the U.S. corporate bond market, reviewing both price- and quantity-based liquidity measures, including trading volume, trade size, bid-ask spreads, and price impact.
Dealers’ Intermediation Is Key in the Corporate Bond Market
Trading of corporate bonds in the secondary market is conducted over-the-counter, with most trading intermediated by dealers. By dealers, we refer to securities brokers and dealers, which are firms that trade securities on behalf of their customers as well as on their own account. When investors want to buy and sell bonds, dealers can match offsetting orders so that they avoid holding bonds on their balance sheets, or they can buy bonds from sellers and hold them on their balance sheets until offsetting trades are found later, thus bearing the risk that prices fall in the interim. The former is called the “agency model” while the latter is called the “principal model.”
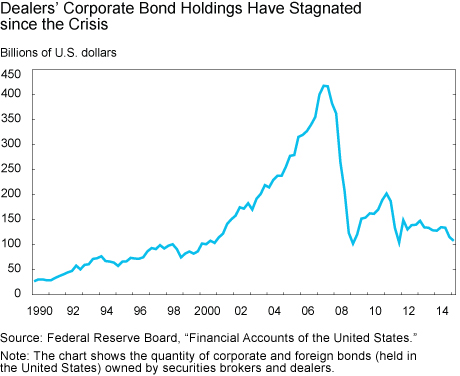
In the corporate bond market, dealers have reportedly shifted from the principal model toward the agency model in recent years, but the ability of dealers to switch trading models without affecting liquidity is limited by the market’s structure. There are tens of thousands of outstanding corporate bond issues with varying maturity, seniority, and optionality characteristics, and this heterogeneity makes it difficult to match demand and supply. As shown in the chart below, dealers’ corporate bond inventories plunged during the financial crisis and have stagnated since—mirroring the balance sheet stagnation of dealers more generally that we documented previously—and raising the question of whether liquidity provision is sufficient.
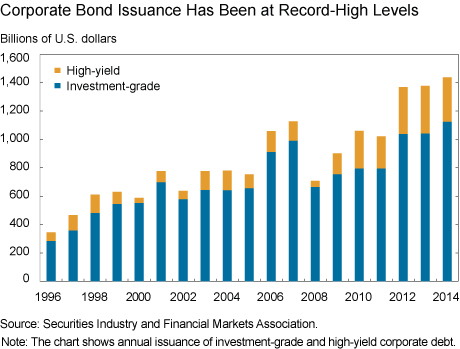
The stagnation of dealers’ corporate bond inventories is particularly stark given the rapid growth in corporate bond issuance and debt outstanding: The chart below shows that U.S. corporate debt issuance reached a record high of $1.4 trillion in 2014. Moreover, corporate debt outstanding was at a record high of $7.8 trillion at the end of 2014.
Trading Volume Has Risen Modestly, but at a Slower Pace Than Issuance
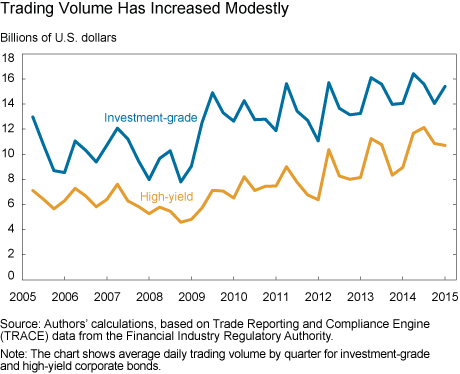
Trading volume has risen over time, especially since the financial crisis, but at a slower rate than debt outstanding. It follows that turnover rates—the ratio of trading volume to debt outstanding—for corporate bonds have declined, which is often pointed to as evidence of reduced liquidity.
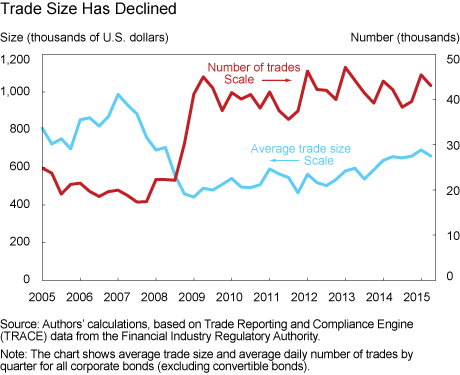
Trading volume reflects the product of the number of trades and average trade size. As shown in the chart below, average trade size has declined since the crisis. Some market commentators see this trend as evidence that investors find it more difficult to execute large trades and so are splitting orders into smaller trades to lessen their price impact.
Bid-Ask Spreads Have Narrowed
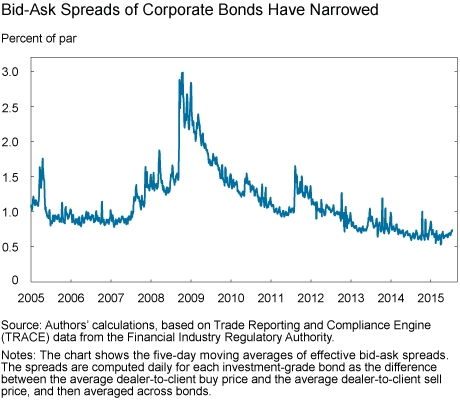
What do more direct liquidity measures, such as bid-ask spreads, say about liquidity conditions? The bid-ask spread is the difference between the price at which dealers are willing to buy (bid) and the price at which dealers are willing to sell (ask). This spread compensates dealers for the risk of holding a bond for some period of time, over which its price might fall.
Since the Financial Industry Regulatory Authority (FINRA) introduced its Trade Reporting and Compliance Engine (TRACE) in 2002, corporate bond bid-ask spreads have narrowed. This trend was interrupted during the 2007-2009 financial crisis, but resumed afterwards. The current level of bid-ask spreads is even lower than pre-crisis levels.
Lower Price Impact
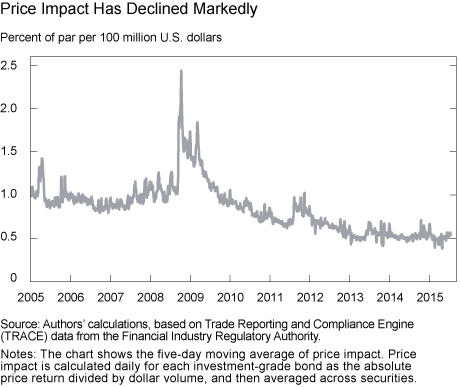
Another useful liquidity measure is the impact that a given trade has on market price. The chart below, based on the methodology in Amihud (2002), shows that price impact has been declining since the crisis and is now well below pre-crisis levels.
In Sum
In conclusion, the price-based liquidity measures—bid-ask spreads and price impact—are very low by historical standards, indicating ample liquidity in corporate bond markets. This is a remarkable finding, given that dealer ownership of corporate bonds has declined markedly as dealers have shifted from a “principal” to an “agency” model of trading. These findings suggest a shift in market structure, in which liquidity provision is not exclusively provided by dealers but also by other market participants, including hedge funds and high-frequency-trading firms.
Disclaimer
The views expressed in this post are those of the authors and do not necessarily reflect the position of the Federal Reserve Bank of New York or the Federal Reserve System. Any errors or omissions are the responsibility of the authors.

Tobias Adrian is the associate director and a senior vice president in the Federal Reserve Bank of New York’s Research and Statistics Group.

Michael Fleming is a vice president in the Bank’s Research and Statistics Group.

Or Shachar is an economist in the Bank’s Research and Statistics Group.

Erik Vogt is an economist in the Bank’s Research and Statistics Group.


 RSS Feed
 Follow Liberty Street Economics
Dear JJ – Thank you for your comment. As we point out in the note to the chart, these spreads are estimated from actual transaction prices. That said, we agree that bid-ask spreads are just one dimension of liquidity and that it’s important to also understand the quantity that can be traded at the inside prices. That’s why we look at quote depth as well as bid-ask spreads and other liquidity measures in our earlier post on Treasury liquidity (http://libertystreeteconomics.newyorkfed.org/2015/08/has-us-treasury-market-liquidity-deteriorated.html). Unfortunately, quote depth for corporate bonds is not available because the securities trade in an over-the-counter market rather than in a central limit order book.
Dear SK – Thank you for your comment. We think that market liquidity is a good, but recognize that there are policy tradeoffs relative to regulations affecting liquidity. Tighter regulations aim to mitigate tail risks, which should greatly benefit liquidity at times of stress, but which may adversely affect liquidity in normal times. One of the goals of the blog post is to gauge the extent to which the presumed reduction in deleveraging risks is associated with a reduction in market liquidity.
unfortunately this analysis misses the intangible – can you actually trade on the supposedly tight bid asks? Unequivocally the answer is no. Or at least – much less than you could have done pre crisis. There is an illusion of liquidity created by Trace and many dealers sending prices but the ability to transact in size at the price on screen at the time of the investors choosing has declined enormously.
The infatuation markets and regulators have with liquidity and transactional costs as a measure of orderliness is dangerous. Such fondness rests on a false premise that liquidity is inherently good. Reductions in transactional costs beyond a point do little more than encouraging trading velocity and leverage, a liquidity induced frenzy of non-productive, marginally economic, activity. This isn’t far from the soothing comfort rating based risk normalization provided not too long ago. Let the world become a tad more illiquid, let people bear a higher cost for their actions and you will end up with a more stable, less jump-prone world. Let’s do that, rather than celebrating market structures resting on shifting sands.