Some banks are quite simple, while others are part of complex multi-layered organizations with affiliates in many industries scattered all around the world. The latter organizations are formally called bank holding companies (BHCs). In this post, we investigate changes in BHC geography, especially the rising share of BHC affiliates in tax havens and financial secrecy jurisdictions. We examine what has happened since 2000, including the period after the 2010 Dodd-Frank Act, which focused attention on the size and complexity of large BHCs. Our analysis complements a growing body of work on large and complex BHCs and their global affiliates, including this blog series based on papers from the Economic Policy Review.
Numbers and Types of U.S. BHCs
A BHC, the highest level of ownership in a banking organization, can encompass many affiliates, legally defined as companies where the BHC owns at least 25 percent of the voting shares or exercises control through another channel such as the board of directors. Using standard regulatory thresholds, we categorize BHCs headquartered in the United States as small or large. The small holding companies have between $500 million and $50 billion in assets, while their large counterparts have more than $50 billion, the threshold for “systemically important financial institutions,” as defined in the Dodd-Frank Act. We also define a third category, recent BHCs, comprising the six large financial firms that converted to BHC status during the financial crisis: Ally Financial, American Express, CIT Group, Discover Financial Services, Goldman Sachs, and Morgan Stanley.
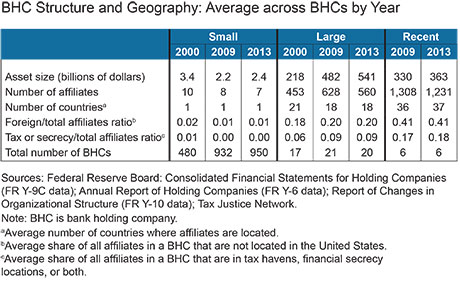
Information on the structure of all these organizations comes from regulatory filings by BHCs, discussed in the recent Liberty Street Economics blog post, “Same Name, New Businesses: Evolution in the Bank Holding Company.” Balance sheet information for BHCs is available through FR Y-9C filings. The snapshots presented below for 2000, 2009, and 2013 illustrate how size and structure have evolved for these three groups of BHCs.

Small BHCs Are Simpler
The vast majority of BHCs are small and simple. On average, they have $2 billion to $3 billion in assets and have ten or fewer affiliates. The number of small BHCs nearly doubled from 2000 to 2009 and then remained relatively flat through 2013. Most small BHC assets reside in their commercial banking affiliates, which mainly engage in traditional banking activities such as issuing deposits and making loans. Virtually all of their affiliates are located within the United States.
Large BHCs Are More Complex and More Geographically Diverse
Large BHCs are quite different from the vantage point of organizational structure and complexity. Their assets and total number of affiliates increased dramatically between 2000 and 2009. Average assets more than doubled from $218 billion to $482 billion, while the average number of affiliates increased by 39 percent from 453 to 628, but this number masks a wide range between 61 and 4,043 affiliates.
The 2010 Dodd-Frank Act put a spotlight on the size, complexity, and overall riskiness of large BHCs. Yet, from 2009 to 2013, large BHC assets actually grew. Meanwhile, the average number of affiliates controlled by large BHCs decreased by more than 10 percent.
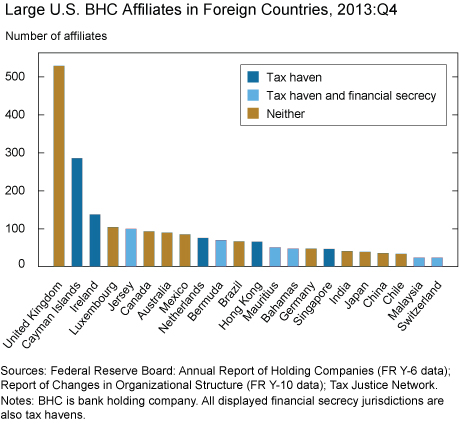
Although the majority of BHC affiliates are located in the United States, a significant share is incorporated abroad. Across the three dates highlighted, foreign affiliates constituted about 20 percent of the affiliates in the average large BHC. On average, these affiliates spanned about twenty different countries. The chart below shows that in 2013, the jurisdictions that hosted the most foreign affiliates of large U.S. BHCs were the United Kingdom, the Cayman Islands, and Ireland, followed by Luxembourg, the Channel Island of Jersey, Canada, Australia, and Mexico. Clearly these locational rankings do not correspond tightly to the economic weights of each country in the global economy.

Tax Havens and Financial Secrecy Jurisdictions Host Many Affiliates
The Tax Justice Network (TJN) categorizes countries as tax havens and financial secrecy locations based on a Financial Secrecy Index. TJN computes a tax haven score for a country based on whether it has laws that encourage tax evasion. It calculates the secrecy score by assessing many characteristics of a country’s legislation including knowledge of asset ownership, corporate transparency, tax and financial regulations, and adherence to international standards and cooperation.
Affiliates of U.S. BHCs located in these types of jurisdictions grew rapidly from 2000 to 2009, with the average share of total affiliates in tax/secrecy locations rising to 9 percent. The geographic distribution of affiliates also became more concentrated: while the Cayman Islands and Ireland made up 24 percent of all tax/secrecy affiliates in 2000, by 2009, this share climbed to more than 40 percent. The share of affiliates in Jersey and the Netherlands also grew, whereas the share in Hong Kong, the British Virgin Islands, and Bermuda decreased.
By 2013, the Cayman Islands and Ireland were the dominant tax haven locations for large BHCs as measured by the number of affiliates, followed by Jersey, the Netherlands, Bermuda, Hong Kong, Mauritius, the Bahamas, Singapore, Malaysia, and Switzerland. Among this group, Jersey, Bermuda, the Bahamas, Malaysia, and Switzerland also are classified by TJN as high financial secrecy locations.
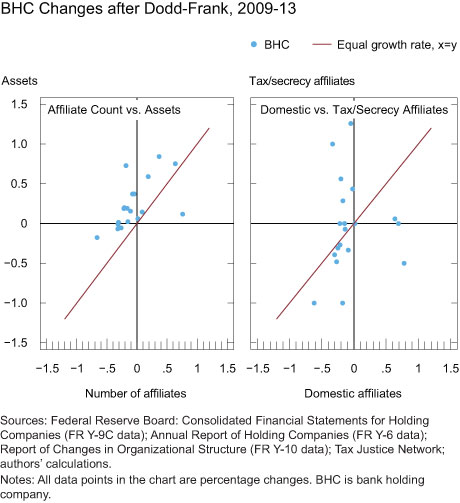
To provide more granular perspective on changes in large BHCs since the Dodd-Frank Act, we examine the relative growth rates of BHC assets and number of affiliates from 2009 to 2013, and over the same period, the growth rates for number of affiliates in the United States and in tax/secrecy locations.
The chart below compares changes for the nineteen large BHCs that existed in both years. The left panel shows that overall, assets rose at all but four BHCs while the number of affiliates declined for all but five. The red 45-degree line indicates equal growth in assets and affiliates. Nearly all of the BHCs are above the line, which means that the growth in assets was greater than the growth in number of affiliates.
The right panel shows that the growth of tax/secrecy affiliates was greater than the growth of domestic affiliates. While domestic affiliates decreased for all but three BHCs, tax/secrecy affiliates either grew or remained similar for all but five BHCs. Thus, the decrease in total affiliates came primarily from a drop in domestic affiliates, while the presence of affiliates in tax/secrecy countries remained relatively higher. About 40 percent of the drop in domestic affiliates came from those that operate as other financial vehicles, miscellaneous intermediation, and offices of other holding companies.

Recent Large BHCs Are Different
In 2009, six large financial firms converted to BHC status and came under Federal Reserve supervision. These recently converted BHCs look quite different from their more “traditional” large BHC brethren: on average they are smaller but more complex, with twice as many affiliates. The average proportion of foreign and tax/secrecy affiliates is also substantially higher. The recent BHCs’ affiliates tend to be spread across more countries, but those in tax/secrecy jurisdictions are more concentrated in the Cayman Islands, home to nearly 60 percent of this group’s tax and secrecy affiliates. Ireland and the Netherlands are the next two most popular tax and secrecy locations. For this group of BHCs, these broad characteristics were basically unchanged between 2009 and 2013.
Overall, this post shows that both the size and the complexity (as measured by the number of affiliates) of large U.S. BHCs increased dramatically from 2000 to 2009. The number of affiliates grew significantly in jurisdictions known for helping companies avoid taxes or having opaque financial systems. Two locations, the Cayman Islands and Ireland, dominated this growth. After the financial crisis and the Dodd-Frank Act, BHCs reduced their number of affiliates. Most of this reduction came from domestic affiliates rather than those in tax havens or financial secrecy jurisdictions.
Related Reading:
Cetorelli, Goldberg, and Gupta, “Measuring Global Bank Complexity,” Liberty Street Economics blog (2014).
Cetorelli and Stern, “Same Name, New Businesses: Evolution in the Bank Holding Company,” Liberty Street Economics blog (2015).
Mui and Niepmann, “Around the World in 8,379 Foreign Entities,” Liberty Street Economics blog (2015).
Disclaimer
The views expressed in this post are those of the authors and do not necessarily reflect the position of the Federal Reserve Bank of New York or the Federal Reserve System. Any errors or omissions are the responsibility of the authors.

Linda S. Goldberg is a vice president in the Federal Reserve Bank of New York’s Research and Statistics Group.


 RSS Feed
 Follow Liberty Street Economics