Our earlier analyses from last October and earlier in this series looked at market liquidity measures averaged across all corporate bonds or broad sub-groups of corporate bonds. Commentators have pointed out that such broad averages might mask important differences among narrower sub-groups of bonds and that relatively illiquid bonds, in particular, have suffered the largest reductions in liquidity. In this post, we consider these arguments by examining how corporate bond market liquidity has changed over time depending on the size and credit rating of the issue.
Empirical Approach
Our empirical approach is to estimate various liquidity measures conditional on issue size and credit rating for the pre-crisis (2003-06), crisis (2007-10), and post-crisis (2011-14) periods. The particular measures we consider are trading volume, trade size, bid-ask spread, and price impact. All measures have played an important role in the recent debate on market liquidity, and all are discussed in our earlier posts. As with our earlier posts, we estimate the measures using Trade Reporting and Compliance Engine (TRACE) data from the Financial Industry Regulatory Authority (FINRA).
Trading Volume
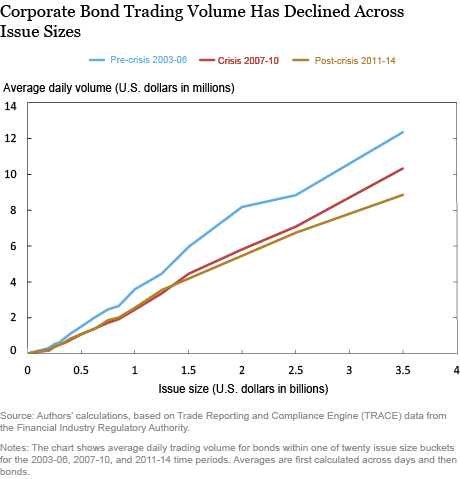
Market participants often point to reduced corporate bond turnover in recent years as evidence of reduced liquidity, noting that trading volume has not kept up with issuance. Indeed, the chart below shows that average per-issue daily trading volume sorted by issue size is lower for the recent period than the pre-crisis period for all but small issues (issue size < $35 million). In contrast, trading volume is comparable for the crisis and post-crisis periods for all but large issues.
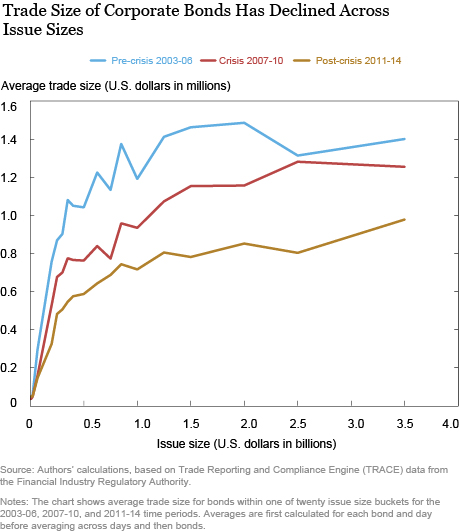
Trading volume is defined as the product of the average trade size and number of trades. The previous finding that volume has declined across all issue sizes when compared with the pre-crisis period is entirely due to the decline in average trade size, as shown in the chart below. The number of trades per issue has, in fact, increased relative to the pre-crisis period, across almost all issue sizes.
The decline in trade size is also a phenomenon observed in the U.S. Treasury market (as shown in our August 2015 blog post), where electronic trading has become predominant. In the corporate bond market, a recent study by FINRA points out that electronic trading is also becoming more important.
Bid-Ask Spreads
We next consider price-based liquidity measures, including bid-ask spreads and price impact. An advantage of such metrics is that they more directly measure transaction costs and hence liquidity. A drawback is that existing data force us to estimate these measures only for bonds that trade. We therefore cannot estimate price-based liquidity measures for bonds that don’t trade on a given day or that only trade once.
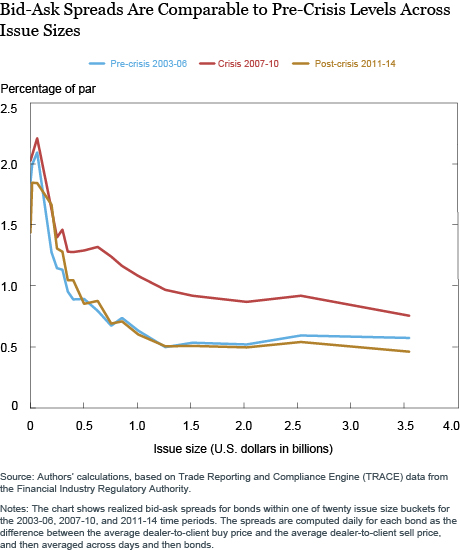
As in our earlier posts, we estimate bid-ask spreads by comparing—for a given bond—the price at which dealers are willing to buy (bid), and the price at which dealers are willing to sell (ask). Such bid-ask spreads tend to decline with issue size, as shown in the chart below, and are now narrower than in the crisis period, consistent with the evidence in our earlier posts. Moreover, spreads are now comparable to those observed pre-crisis, although there are some differences for the smaller issue sizes.
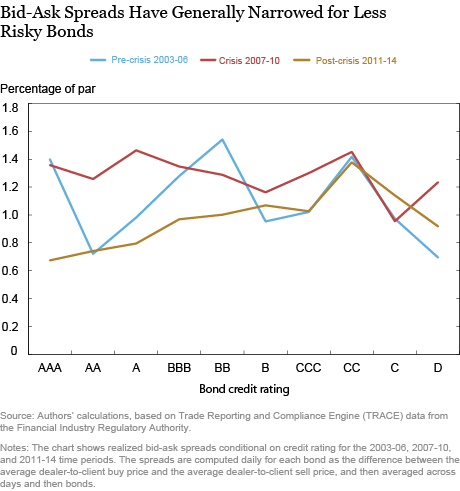
Sorting the data by credit rating suggests that the narrowing of bid-ask spreads relative to the crisis period is concentrated in the more highly rated securities, as shown in the following chart.
Price Impact
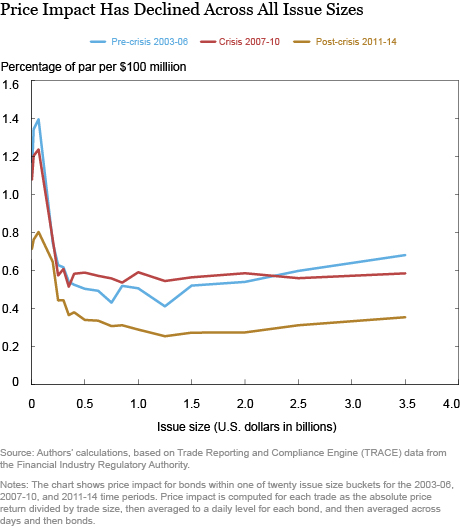
Another important liquidity metric we consider is price impact, which seeks to gauge how much a bond’s market price changes as the result of a given trade. We estimate price impact as the absolute price change divided by trade size, in line with the measure proposed by Amihud and our earlier posts. As shown in the next chart, price impact tends to decline with issue size, as one might expect. Moreover, price impact has declined across all issue sizes over time, consistent with the evidence in our earlier posts (but was roughly similar, on average, in the pre-crisis and crisis periods).
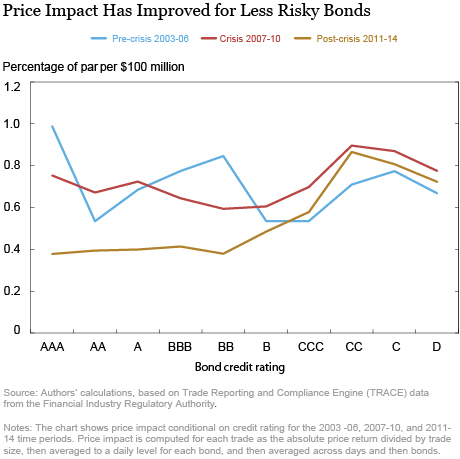
When we look at the data sorted by credit rating in the next chart, we see the reduction in price impact is concentrated among bonds rated single B or higher. For bonds rated CCC and below, price impact has increased relative to the pre-crisis period, but is less than that observed during the crisis.
Takeaways
Our results show that there is indeed a heterogeneous evolution of liquidity metrics across bonds with different characteristics. Bonds with higher credit ratings tend to have narrower bid-ask spreads and lower price impact than they did during the crisis or pre-crisis periods. Such patterns are generally not observed for bonds with lower ratings. The picture that emerges is one where liquidity may have deteriorated slightly since the pre-crisis period for corporate bonds with the lowest credit ratings, but has otherwise improved.
Disclaimer
The views expressed in this post are those of the authors and do not necessarily reflect the position of the Federal Reserve Bank of New York or the Federal Reserve System. Any errors or omissions are the responsibility of the authors.
 Tobias Adrian is the associate director and a senior vice president in the Federal Reserve Bank of New York’s Research and Statistics Group.
 Michael Fleming is a vice president in the Bank’s Research and Statistics Group.
 Erik Vogt is an economist in the Bank’s Research and Statistics Group.
 Zachary Wojtowicz is a research analyst in the Bank’s Research and Statistics Group.


 RSS Feed
 Follow Liberty Street Economics