The interdealer market for Treasury securities shares many features with other highly liquid markets that trade electronically using anonymous central limit order books. The interdealer Treasury market, however, contains a unique trading protocol, the so-called workup, that accounts for the majority of interdealer trading volume. While the workup is designed to enhance liquidity in a market with diverse participation, it may also delay certain price-improving order book adjustments and therefore affect price discovery. In this post, we exploit the tight relationship between the ten-year Treasury note traded on the BrokerTec platform and the corresponding Treasury futures contract to explore how the workup protocol affects trading in the interdealer market and to highlight the impact of technological changes on observed trading behaviors.
The Workup
Under the workup protocol, the execution of a marketable order against the central limit order book (CLOB) opens a short window of time during which market participants can transact additional volume at the workup price. The workup continues as long as there is trading interest at the workup price, and it terminates automatically after a fixed period of inactivity. The rules governing the workup on the BrokerTec platform have changed several times since BrokerTec was first introduced in 2001, with those changes coming in response to changing participation and trading practices. In particular, the default duration of the “public phase” (the only phase of the workup as it exists today) was gradually shortened from 10 seconds to 3 seconds, as described in a previous post. However, the shortening of the workup duration has not kept pace with the increased frequency of trading and the two measures now differ by several orders of magnitude. For instance, the typical (median) time between trades in the ten-year Treasury note observed on the BrokerTec platform in 2015 was roughly 10 milliseconds, or about one hundred times faster than in 2006, when trades typically occurred one second apart, as seen in the chart below. Moreover, the increasing divergence between the average and median time between trades reflects that trades increasingly occur in short, intensive bursts of activity characteristic of high-frequency trading strategies.
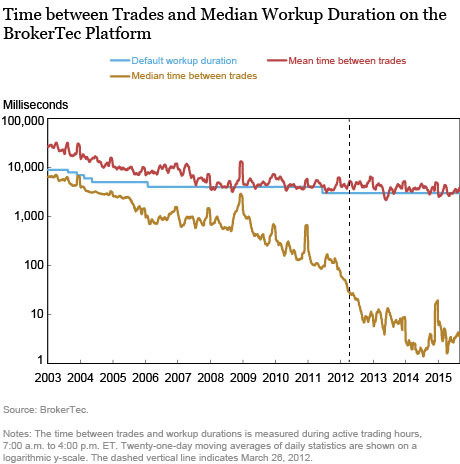
Alongside these market design developments, the technology and infrastructure supporting trading on the BrokerTec platform also evolved, most notably with the introduction of a modified version of the NASDAQ OMX Genium INET technology in March 2012, which led to greatly improved market data feeds and reduced order input latency by a factor of fifty, from 10 milliseconds to about 200 microseconds. This technology change preceded the most recent drop in time between trades, shown by the dashed line above.
The Workup and Bid-Ask Spreads
While a workup is in progress, a sufficiently aggressive order that cannot be matched at the workup price but can be matched against a standing limit order deeper in the CLOB will terminate the current workup immediately and initiate a new workup at the improved price. However, when spreads are two or more ticks wide, a price-improving order that cannot be matched at the workup price or against the CLOB is placed in the order book at the workup price, rather than the improved price, for the duration of the workup. Once the workup ends, the price of the order (if unfilled) will be adjusted to the improved price, resulting in a narrower market spread. Thus, a workup in progress may delay certain price-improving order book adjustments for the duration of the workup and prevent the narrowing of spreads that would reflect actual trading interest.
The variation in spreads is shown in the chart below, which displays how often the bid-ask spread was at its tightest during active trading hours when a workup was in progress versus when no workup was in progress. The frequency is computed as a fraction of “time ticks” (order book changes or trades) such that workups that end almost immediately (as a result of a trade-through) will tend to carry a low weight.
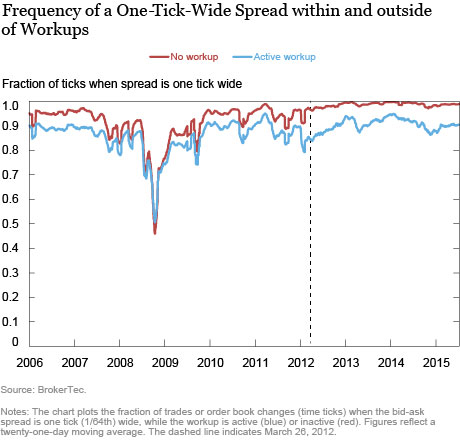
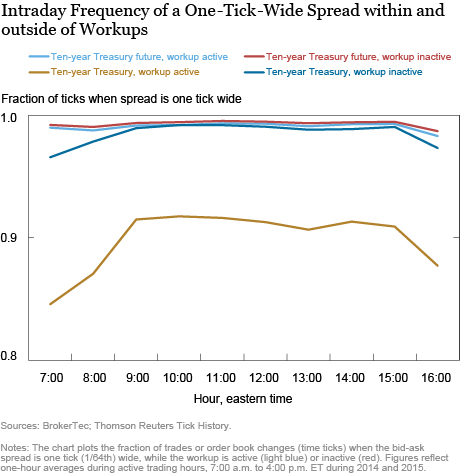
Except for a brief period during the financial crisis, the observed bid-ask spread was more frequently wider than one tick during active workups compared with times when no workup was in progress, with the difference being especially notable starting in early 2012. During this most recent period, the observed spread was almost always one tick when no workup was in progress. When workups were in progress, however, the spread exceeded one tick around 10 percent of the time on many days. The chart below shows that this pattern holds true intraday as well and that the spread in the futures market is almost always one tick wide and does not appear to be affected by whether a workup is in progress in the cash market. The workup-related difference in observed cash market spreads is therefore unlikely to be information related, nor a function of how workups are distributed across trading hours.
Time Concentration of Workup Trading
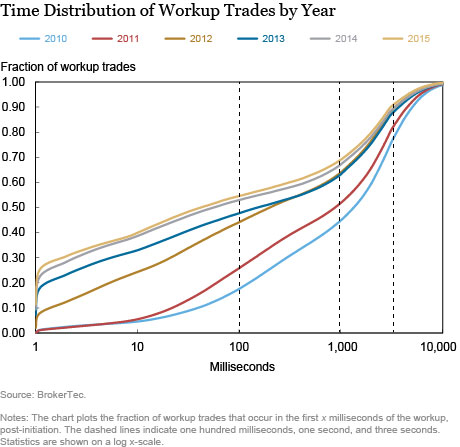
As documented in a previous blog post, the share of trading inside the workup has steadily increased from around 50 percent in 2006 to almost 66 percent in 2015. The chart below shows that the share of volume transacted during the first 100 milliseconds of a workup post-initiation (faster than a human trader can react) has jumped from less than 10 percent pre-2008 to almost 60 percent by 2015, while more than 25 percent of trades now occur within 1 millisecond of the workup starting. When we include the 33 percent of volume associated with workup-initiating trades, this implies that about 73 percent of all interdealer transaction volume occurs in concentrated sub-100-millisecond bursts of activity around the initiation of workups. While the burst-like nature of trading reacting to new workups is clearly prominent, it is also worth noting that the chart below shows that almost 30 percent of trading in the public phase occurs more than one second into the workup.
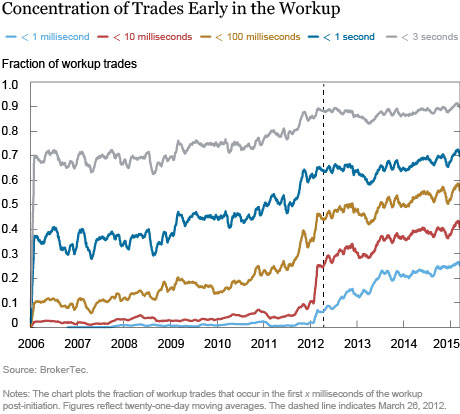
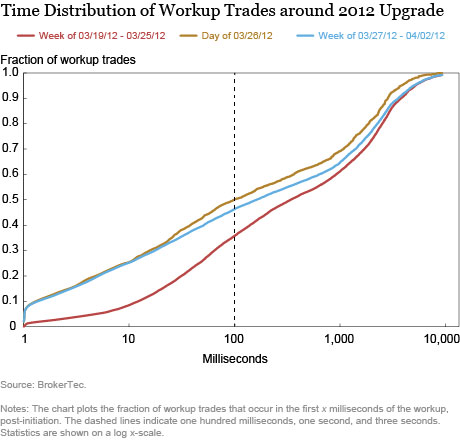
The chart below plots the cumulative fraction of workup trades occurring within a given time interval of the beginning of the workup, by year. The chart shows a steady progression toward earlier trading in the workup, most dramatically in 2012. In order to isolate the impact of technological changes on observed trading behaviors and market microstructure, the second chart below displays the distribution of trade times on March 26, 2012, compared with the distribution during the prior and subsequent weeks. The shift toward earlier trading in the workup essentially appears to have occurred abruptly from one day to the next as new technology and improved market data feeds allowed high-frequency strategies to react more quickly.
Price Efficiency of Workup Trades
To the extent that futures and cash Treasuries are close substitutes and participants have access to both markets, one would expect workup trades to occur primarily when the workup price is in synch with the futures price. If the prevailing workup price were not efficient, the expectation would be that either an aggressive order would trade through and end the workup early, or there simply would be no trading in the workup.
To investigate the degree to which workup trades occur only when the workup price is competitive, we use Treasury futures prices as a proxy for how the “efficient” cash price would have evolved absent a workup. The basis between the future and cash prices is relatively stable over short periods, so one may treat workup trades that occur when the futures price has changed significantly since the start of the workup as a rough proxy for trades at inefficient prices. In the chart below, we see that, since March 2012, over 80 percent of workup trading volume occurred when the futures price had not moved since the workup began, with the remaining volume transacting when the futures price had changed by at most one tick. In the earlier part of the sample, these percentages were somewhat lower, consistent with the tighter linkages between the Treasury futures and cash markets in the more recent period documented in a previous post.
Summary
While the workup has a long history as a mechanism for improving liquidity in the interdealer market, our findings suggest that the design of the workup may result in an increased incidence of wider spreads. One likely reason for this is that signaling of trading interest at an improved price in certain circumstances is delayed while a workup is in progress. This suggests that price discovery in the cash market could be impacted, which would increase the relative importance of the futures market in the price discovery process for U.S. Treasury securities, consistent with the well-documented lead-lag relationship of Treasury cash-futures cross-market high-frequency trading.
The shortening of the workup duration since 2006 has clearly not kept up with the increased speed and growth of automated trading, especially following the March 2012 platform technology upgrade. Our analysis shows that almost three quarters of trading is concentrated during the first 100 milliseconds of a workup (including the workup-initiating trade), while trading during the remaining workup is more sporadic and almost exclusively occurs while the futures market (our proxy for the efficient market price) has moved by at most one tick. In an evolving market with diverse participation, including a small but important group of non-algorithmic and manual traders, our analysis therefore highlights some of the potential trade-offs involved in designing a workup that balances the liquidity needs of all participant types with the goal of promoting diversity of participation.
Disclaimer
The views expressed in this post are those of the authors and do not necessarily reflect the position of the Federal Reserve Bank of New York or the Federal Reserve System. Any errors or omissions are the responsibility of the authors.
 Ernst Schaumburg is the head of analytical development and an assistant vice president in the Federal Reserve Bank of New York’s Integrated Policy Analysis Group.


 RSS Feed
 Follow Liberty Street Economics