Editors’ Note: The original version of this post slightly overestimated the fraction of people of all types (low income, minority, etc.) who live in banking deserts. This version reports the correct figures. None of the substantive conclusions were affected. (Updated July 12, 2016)
U.S. banks have shuttered nearly 5,000 branches since the financial crisis, raising concerns that more low-income and minority neighborhoods may be devolving into “banking deserts” with inadequate, or no, mainstream financial services. We investigate this issue and also ask whether such neighborhoods are particularly exposed to branch closings—a development that, according to recent research, could reduce credit access, even with other branches present, by destroying “soft” information about borrowers that influences lenders’ credit decisions. Our findings are mixed, suggesting that further study of these concerns is warranted.
Debranching since the Crisis
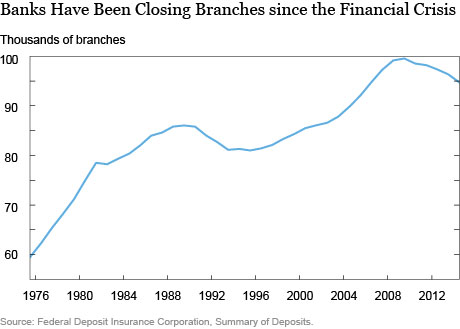
U.S. banks closed 4,821 branches between 2009 and 2014, reducing the total number of branches by about 5 percent (see chart below). Since branches per capita are declining, this isn’t simply a story of shifts in population among regions. The forces driving the trend are not entirely clear, but as usual (in the view of economists), they could be demand- or supply-driven; banks may be closing branches that have become unprofitable because the demand for physical branch services has decreased (owing to slower economic growth since the crisis or increased online banking) or because the cost of supplying those services has increased (owing to more stringent bank regulation or other factors). Although identifying the causes of the debranching trend is clearly important, we cannot resolve this issue here. Instead, we focus on a possible consequence, namely, whether the debranching and the banking deserts that might result are affecting lower income and minority communities disproportionately.
How Big Is a Desert?
A banking desert is usually defined as an area with no banks or branches, but there is no standard definition of how big such an area should be. Following previous research, we define a banking desert as a census tract—a relatively homogeneous area or neighborhood containing about 4,000 people—with no branches within ten miles of the center of the tract (a study by Federal Reserve Board researchers that used 2003 data found that, nationwide, the median distance between a small firm and its main bank was just five miles). While traveling ten miles to deposit a check or withdraw cash might seem merely inconvenient (or not even that if an ATM is nearby), evidence suggests that access to bank credit, particularly for small businesses, declines as the distance between the bank and borrower grows. In addition, this 2005 Journal of Finance study found that small business loan rates increased with the distance between firm and bank. As with real estate, location matters for customers’ access to and use of banking services.
Of course, a banking desert is not necessarily the same as “financial services desert” if alternative providers such as check cashing firms, pawn shops, and payday loan stores are available instead. However, these “fringe” providers are considered to be part of the problem by some consumer advocates, and they certainly aren’t known to supply small business loans or mortgages.
To delineate banking deserts, we start with annual, geo-coded data on bank branches from the Federal Deposit Insurance Corporation and then merge it with tract-level data on household income and race from the 2000 census. For the income analysis, we calculate the share of the population in low-income (bottom quartile) tracts that resides in a banking desert. The cutoff for the bottom quartile is $30,177 (2000 dollars) and the median income within such tracts is $24,375. For race, we calculate the share of the population in “majority-minority” tracts (those where more than 50 percent of the residents are black or Hispanic) that resides in a banking desert.
We deliberately avoid using the more recent 2010 census data because we expect that changes in demographics may be related to debranching. For example, tracts where debranching was occurring over the first decade of the 2000s might also be more likely to become low-income by 2010. Importantly, our conclusions are essentially unchanged if we interpolate demographics using the 2000 and 2010 censuses.
Are Residents of Low-Income and Majority-Minority Tracts More Likely to Live in a Banking Desert?
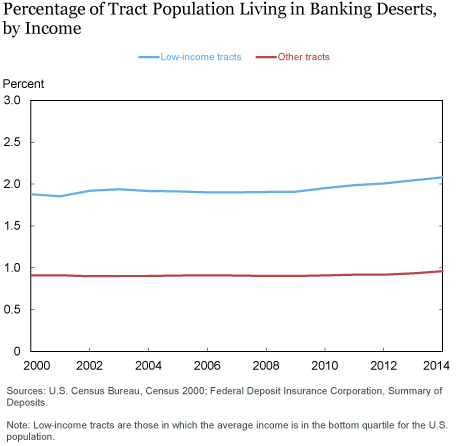
In short, yes and no. The chart below shows that people in low-income tracts are more than twice as likely to live in a banking desert than their counterparts in higher income tracts. While that’s a useful fact for thinking about financial inclusion, it might simply mean that higher-income households demand more financial services. Potentially more worrisome are the relative changes since the crisis: from 2009 to 2014, the fraction of residents living in low-income tracts that are also banking deserts increased 0.17 percentage points, almost three times the 0.06 percentage point increase for residents in higher income tracts.
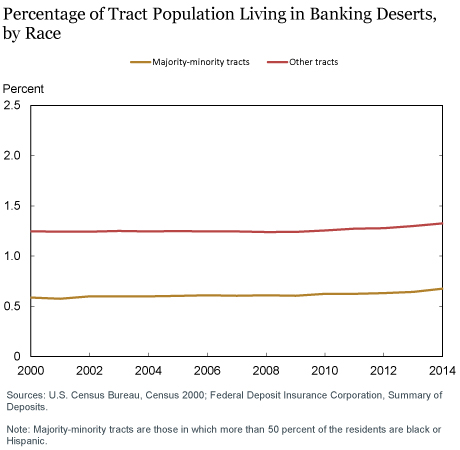
By contrast, the chart below reveals that residents of majority-minority tracts were actually less likely to live in a banking desert than their counterparts in non-minority tracts. This finding presumably reflects the fact that majority-minority tracts are more likely located in densely populated urban settings, where thick branch networks are sustainable, as opposed to sparsely populated rural areas that cannot sustain even a single branch. More notable is that, since the crisis, the share of the majority-minority tract population residing in a banking desert increased by less than the corresponding share of the non-minority tract population; the change since 2009 was 0.07 for majority-minority tracts and 0.09 for other tracts.
Branch Closings and Soft Information Loss
The mere closing of a branch—even if other branches remain in the same area—can reduce the supply of mortgages and small business credit. A recent study by a U.C. Berkeley economist found that when merging banks closed a branch, the number of small business loans made in the tract fell by 13 percent for more than eight years afterward. The supply of mortgages fell as well, but only temporarily. The contraction in both types of lending was concentrated in precisely the kind of tracts we are concerned about: low-income and majority-minority. It was this study, and the latter finding in particular, that motivated us to look beyond banking deserts at branch closings as well.
Surprisingly, the author found that the contraction in small business lending persisted even after a new branch opened. This suggests that the contraction may have stemmed not from reduced competition but from the information that is lost when a local branch-business relationship is severed. Small business lending is considered particularly reliant on soft information. Branch managers’ personal knowledge of borrowers’ intangible traits (character, competence, work ethic, and so forth) and local business conditions can inform their lending decisions, along with the usual hard information (credit score, balance sheet status, and collateral). Soft information, by definition, is subjective and hard to transmit, so if a branch manager is fired when a branch is closed, the information may not be recoverable and the manager’s former small business borrowers may pay more for credit or go without.
Who Is More Exposed to Branch Closings?
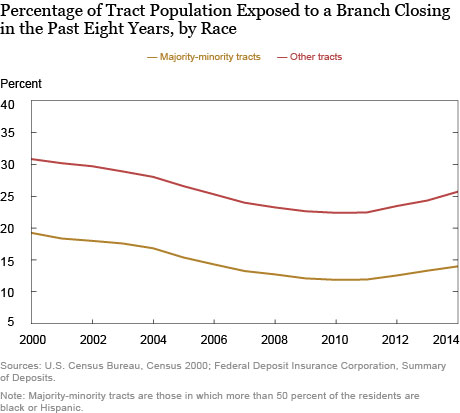
Below we plot the share of the low-income and majority-minority tract populations that were exposed to a branch closing anytime over the previous eight years against the corresponding share of all other tract populations. The eight-year threshold is from the Berkeley study mentioned above.
The first chart shows that residents of low-income tracts are actually less exposed to branch closings—both in general (since 2000) and, more specifically, since the crisis. From 2009 to 2014, the fraction of the low-income tract population that was exposed to branch closings in the last eight years increased by 2.0 percentage points. By contrast, the fraction of the high-income tract population that was exposed to branch closings increased by 3.1 percentage points.
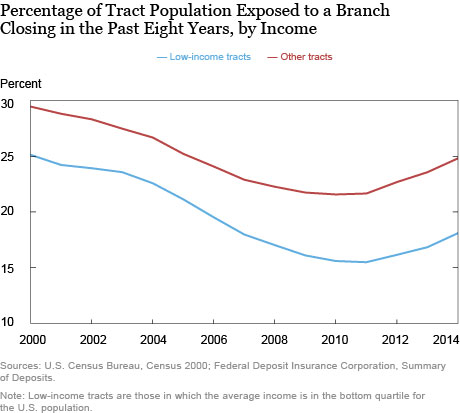
This finding, along with our earlier finding (second chart) that low-income tracts have become somewhat more likely to be part of a banking desert, suggests, incidentally, that low-income tracts experienced fewer branch openings to compensate for branch closings.
The chart below provides the same comparision by race, with similar results. Residents of majority-minority tracts have been less exposed to debranching since 2000 and since the crisis. From 2009 to 2014, the share of the majority-minority tract population exposed to a branch closing increased by 1.9 percentage points; the share in all other tracts exposed to a branch closing rose by 3.1 percentage points.
Takeaways
The closing of nearly 5,000 bank branches since 2009 has generated understandable concern that low-income or minority communities are losing access to mainstream financial services. Consistent with that concern, we find that residents of low-income neighborhoods have become somewhat more likely to live in a banking desert since the crisis. By contrast, we find that low-income and majority-minority tracts were actually less exposed to branch closings. Nevertheless, the evidence that motivated us to look at branch closings indicates that such neighborhoods are most harmed by debranching, suggesting that concerns remain.
Chart Data
A list of banking deserts in 2014 and their locations.
Disclaimer
The views expressed in this post are those of the authors and do not necessarily reflect the position of the Federal Reserve Bank of New York or the Federal Reserve System. Any errors or omissions are the responsibility of the authors.

Donald P. Morgan is an assistant vice president in the Federal Reserve Bank of New York’s Research and Statistics Group.

Maxim L. Pinkovskiy is an economist in the Bank‘s Research and Statistics Group.

Bryan Yang is a senior research analyst in the Bank’s Research and Statistics Group.


 RSS Feed
 Follow Liberty Street Economics