Supervisors monitor banks to assess the banks’ compliance with rules and regulations but also to ensure that they engage in safe and sound practices (see our earlier post What Do Banking Supervisors Do?). Much of the work that bank supervisors do is behind the scenes and therefore difficult for outsiders to measure. In particular, it is difficult to know what impact, if any, supervisors have on the behavior of banks. In this post, we describe a new Staff Report in which we attempt to measure the impact that supervision has on bank performance. Does more attention by supervisors lead to lower risk at banks and, if so, at what cost to profitability or growth?
How to Identify Supervisory Attention
The primary challenge in assessing the impact of supervision on banks is to find differences in supervisory attention that are not themselves determined by bank performance. For instance, supervisors deliberately allocate extra attention to large, complex, or poorly performing banks. Unless we account for this tendency, we might erroneously conclude that supervision perversely increases the size or riskiness of banks.
We attempt to solve this problem by identifying variation in attention that is arguably not itself driven by the health or complexity of the bank—that is, exogenous variation. Our strategy is to exploit the structure of supervision within the Federal Reserve System. Each bank holding company (BHC) is supervised by one of the twelve regional Federal Reserve Banks, with the assignment based on the location of the BHC’s headquarters. Our assumption is that, within each Fed district, the largest institutions receive the most supervisory attention; we base this assumption on the fact that these institutions are the focus of regional supervisory staff, rather than that they demand attention as a result of their performance. Because the size of institutions varies across districts, we can compare the largest banks in one district to similar banks that are not among the largest in other districts and attribute differences to greater supervisory attention.
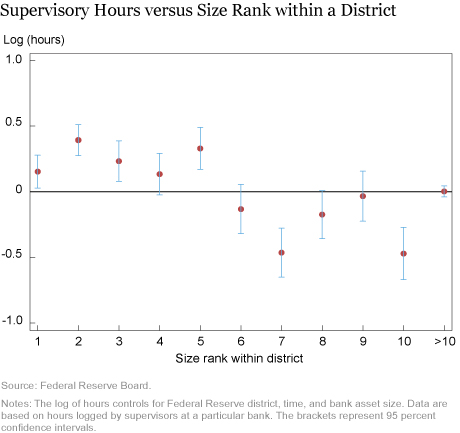
We verify our assumption that the largest banks in a district receive outsized attention by using internal Federal Reserve management data on the number of hours logged by supervisors working on a particular BHC. The chart below illustrates variation in hours (in logs) spent on each BHC as a function of the BHC’s size rank within its district, where we control for the district, quarter, and asset size of the bank. Consistent with our assumption, the largest BHCs within a district, specifically the five largest, receive more supervisory hours. The results suggest that the “top five” BHCs in a district receive 15 to 50 percent more supervisory hours than a similarly sized BHC that is not among the top five.

What Is the Impact of Supervision?
Given this variation in supervisory intensity, we compare outcomes for the top five BHCs in a district to otherwise similar firms that are not among the top five in their district. We attribute differences across these groups to the greater supervisory attention paid to the largest BHCs in a district. Further details on how we match BHCs can be found in the Staff Report.
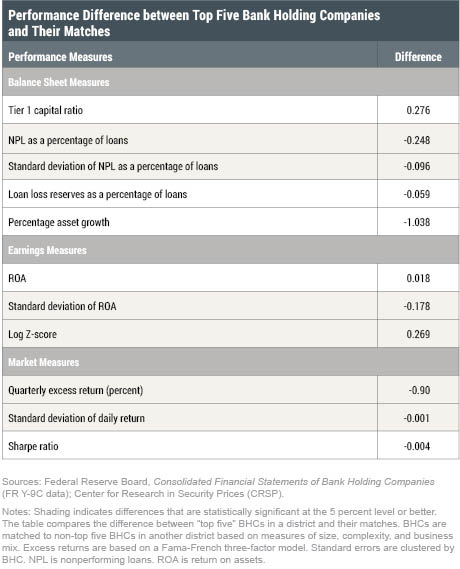
We examine a variety of outcomes that capture bank risk and performance. The table below summarizes our findings. The left column lists the measures being compared and the right column shows the differences between top five BHCs (those receiving more supervisory attention) and their non-top five matches (the group that does not receive additional supervisory attention). Shaded rows indicate differences that are statistically significant.
We start with several accounting-based measures from bank balance sheets. The Tier 1 capital ratio is higher for the top five BHCs, but the difference is not statistically meaningful, suggesting that greater supervisory attention is not meaningfully associated with differences in leverage. However, we find that the percentage of nonperforming loans (NPLs) is lower for the top five BHCs, as is the standard deviation of that percentage—a measure of variation in NPLs over time. A loan is nonperforming if the borrower is late on its payments by ninety days or more, or if the bank has stopped accruing interest on the loan. Lower and less variable NPLs are consistent with less risky lending at the BHCs receiving more supervisory attention.
In contrast to the variation in NPLs, the level of loan loss reserves is not significantly different between these two groups of banks. Given that the NPLs differ, the similarity in reserves suggests that the top five BHCs are more conservative in their accounting for loan losses, because they set aside similar amounts of reserves but experience fewer and less variable problem loans. Lastly, we find that asset growth is slightly lower at top five firms, but the difference is not statistically significant. As a whole, these balance sheet metrics suggest that greater supervisory attention is associated with safer balance sheets. The leverage, growth, and reserving practices of top five BHCs are comparable to those of similar BHCs outside the top five, but the top five BHCs have fewer problem loans.
We also compare earnings measures across these two groups of banks and find that the return on assets (ROA), a measure of profitability, is similar. But we find that the volatility of ROA is lower for top five banks, consistent with these firms being less risky. We calculate an accounting-based measure of distance to default, the log Z-score, and find that the top five BHCs are further from default relative to their matches. These results reinforce our balance sheet findings by suggesting that greater supervisory attention is associated with lower bank risk.
Our final set of measures is based on market prices. The behavior of equity prices can reveal information about the market’s perception of risk, which may be distinct from what we can learn from accounting measures. We find that equity returns are lower for top five banks, but that the standard deviation of these returns is also lower. We do not find a statistically meaningful difference in the Sharpe ratio, which measures the amount of excess return per unit of risk. Hence, the reduction in returns is proportional to the decline in risk.

Takeaways
It is difficult to estimate the distinct role supervision plays in the behavior of regulated entities. We employ a novel approach to estimate the impact of supervision on bank outcomes. Our strategy is to compare banks that are large for their supervisory district to similar banks that are not the largest in their district. Our results suggest that increased supervisory attention is associated with reduced riskiness of banks, without a significant impact on earnings or growth. When we examine stock returns, we also find reduced riskiness but with a commensurate trade-off in returns. Overall, the results suggest that supervision reduces the riskiness of banks but without significantly impacting their growth or profitability.
Disclaimer
The views expressed in this post are those of the authors and do not necessarily reflect the position of the Federal Reserve Bank of New York or the Federal Reserve System. Any errors or omissions are the responsibility of the authors.

Beverly Hirtle is a senior vice president in the Federal Reserve Bank of New York’s Research and Statistics Group.

Anna Kovner is an assistant vice president in the Research and Statistics Group.

Matthew Plosser is an economist in the Research and Statistics Group.


 RSS Feed
 Follow Liberty Street Economics