What is the purpose of health care? What is the purpose of health insurance? When people fall ill, they seek health care in order to get better. But insurance has a slightly different function: Its main role is not to protect our health per se, but to protect our finances. For most people, lifetime health expenditures are quite low. However, some people have enormous health costs owing to major illnesses or health conditions. And this is where health insurance comes in—its goal (like that of any other form of insurance) is to protect these individuals against large, and sometimes ruinous, health expenditures. Has the recent health reform served this purpose?
Protection against financial hardship was one of the drivers behind passage of the 2010 Patient Protection and Affordable Care Act, commonly known as the Affordable Care Act (ACA). As President Obama said in a 2015 weekly address, “. . . that’s the whole point of health insurance. Peace of mind.” In 2009, before passage of the ACA, uninsured rates had hit 16.7 percent in the United States. The ACA aimed to decrease the number of uninsured using a few techniques, including the expansion of Medicaid to include all adults up to 133 percent of the poverty line. However, in 2012 the U.S. Supreme Court determined that the federal government could not force states to expand Medicaid; as of March 2016, nineteen states had declined to expand the program. The U.S. Census Bureau has found that between 2013 and 2014, Medicaid expansion states had a greater decrease in their uninsured rates than states that did not expand Medicaid.
In this blog post, we discuss the results of a research project that examines the effect of the Affordable Care Act’s Medicaid expansion on personal financial indicators. We find suggestive evidence that after the implementation of the ACA in the first quarter of 2014, counties with a high uninsurance burden pre-reform in states that subsequently expanded Medicaid had a decrease in average debt sent to collections agencies compared with such counties in states that did not expand Medicaid.
Our findings are consistent with prior research that has provided evidence that health insurance is good for individual finances (for example, Finkelstein et al., which examines the 2008 Medicaid expansion in Oregon). Our results also mirror those in a contemporary paper by Hu et al., which, using the same data set (described below) but a different methodology, finds that Medicaid expansion reduced the “amount of debt sent to third-party collections agencies” for low-income uninsured individuals in participating states. While these results are encouraging, it is important to note that the analyses mentioned above, as well as our analysis, focus on the benefits of the ACA expansion and do not consider the associated costs.
Has the Medicaid expansion in the ACA helped individuals with their financial burdens?
We use data from the Federal Reserve Bank of New York’s Consumer Credit Panel (CCP), which includes a wide array of financial indicators for individuals across the United States drawn from Equifax credit report data (see Lee and van der Klaauw [2010] for more information). Our main variable of interest is the total value of balances sent to a third-party collection agency within twelve months (referred to as “collections”). We observe data from the first quarter of 2009 to the fourth quarter of 2015. Since the CCP does not collect insurance status for its respondents, we aggregate our data to the county level. Then we match each county with its uninsured rate in 2013, as given by the Census Bureau’s Small Area Health Insurance Estimates. The idea behind this methodology is that the expansion of Medicaid under the ACA should have had a larger impact on counties that had a high uninsured rate prior to implementation. If Medicaid expansion indeed decreased collections, we should see collections fall the most in these high-uninsurance-rate counties.
Next, using the 2013 uninsured rate distribution, we assign counties to five uninsured rate quintiles. Counties in the first quintile had the lowest 2013 uninsured rate (and therefore we would expect the Medicaid expansion not to have had much of an impact), while counties in the fifth quintile had the highest 2013 uninsured rate (and therefore we would expect that the Medicaid expansion could have had a sizable impact). The average uninsured rates in the first and fifth quintiles were 14.5 percent and 29.8 percent, respectively.
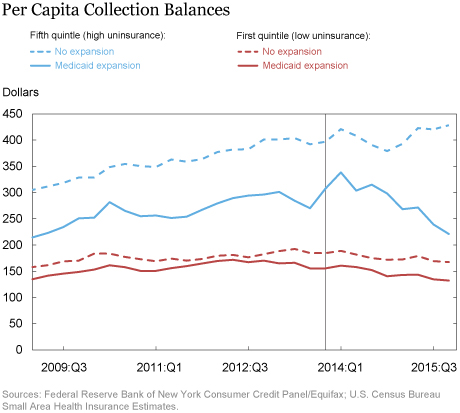
In the chart below, we track the time path of average collection balances per person for counties in the first and fifth quintiles, broken down by whether the county is in a state that did or did not expand Medicaid. As we can see, prior to the implementation of the Medicaid expansion in the first quarter of 2014, counties in both the first and fifth uninsurance quintiles followed parallel trends, regardless of whether they were in states that expanded Medicaid or not. These trends remained mostly parallel for all counties in the first quintile, even after the first quarter of 2014 (the red lines in the chart below). However, that’s not the case for counties with the highest baseline uninsured rates. The paths of these counties diverge after the first quarter of 2015: Collection balances decrease sharply for fifth quintile counties in Medicaid expansion states (the solid blue line in the chart below) but continue their upward trend for fifth quintile counties in states that did not expand Medicaid (the dashed blue line in the chart).

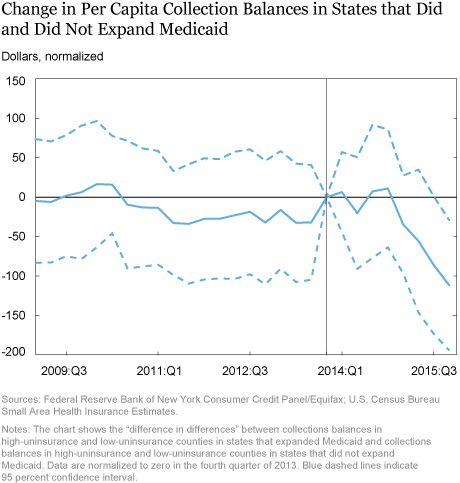
We build on the pattern observed in the chart above by doing a more formal analysis of the change in collections across counties in states that did and did not expand Medicaid. For each quarter from 2009 to 2015, we construct the difference between collections in high-uninsurance and low-uninsurance counties in states that expanded Medicaid, and subtract from it the difference between collections in high-uninsurance and low-uninsurance counties in states that did not expand Medicaid. We also control for the fact that collections change over time, and for the fact that different counties have different levels of collections to begin with. We plot this difference in differences and its 95 percent confidence interval over time in the chart below. As we are primarily interested in what happens to this series after the fourth quarter of 2013, we normalize it to zero in that quarter.

We see that between 2009 and 2015, the series is statistically and economically indistinguishable from zero in every quarter, which is consistent with the constant and parallel trends of the series in the first chart. This means that collections in counties that did not expand Medicaid grew along similar trends as in counties that did. However, starting in the first quarter of 2015, the difference in differences turns sharply negative. By the fourth quarter of 2015, the chart indicates that, on average, collections declined by more than $100 per capita in the counties most affected by the Medicaid expansion relative to less affected counties. This is a sizable decline, given that the mean of collection balances over our sample period is $280 (and the standard deviation is $186). Note that the declines do not start as soon as the ACA is implemented (in the first quarter of 2014)—this should not be surprising since bills can take many months to enter collections.
Our methodology controls for the influence of many potentially confounding factors. For example, states that have expanded Medicaid are different from states that have not (for example, they are in different regions of the country), and therefore, their collections could be evolving along different trends. Similarly, counties with high uninsurance are systematically different from counties with low uninsurance (they are lower-income), and their collections could follow differential trends over time. However, since we are comparing low- and high-uninsurance counties across states that expanded Medicaid and states that did not, we can fully account for these differential trends without attributing them to the Medicaid expansion. Our only worry would be if at the end of 2013, the states that had expanded Medicaid also adopted a different program that affected high-uninsurance counties differently from low-uninsurance counties, but this does not seem to have happened.
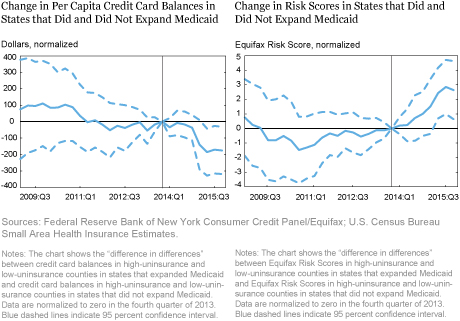
A natural follow-up is whether Medicaid expansion has impacted other financial outcomes. In the chart below, we report impacts from an exercise similar to that in the chart above, except that we now look at two other outcomes of interest. The left panel shows the evolution of credit card balances per person. More precisely, it shows the difference in credit card balances in high-uninsurance and low-uninsurance counties in states that expanded Medicaid, relative to the same difference in high-uninsurance and low-uninsurance counties in states that did not expand Medicaid. The series is indistinguishable from zero in every quarter except the last three, where it is negative, weakly suggestive of average per capita credit card balances declining in the counties most affected by the Medicaid expansion. (The estimate in the fourth quarter of 2015 indicates an average decline of a little less than $200; for comparison, over the sample period, the mean per capita credit balance is $2,614, with a standard deviation of $914).

The panel on the right, above, shows corresponding estimates in the case of the Equifax Risk Score (a measure of an individual’s creditworthiness that is similar to the FICO score). Again, while the series is not distinguishable from zero for the most part, toward the end we see a modest average increase in risk scores in counties most affected by the Medicaid expansion. These results on risk scores are consistent with the results we reported earlier on collections, since collections affect credit scores. Over time with new data, we will be able to see if these effects are persistent.
Conclusion
While the full effects of the Affordable Care Act on financial health are yet to be seen, and while the effects of the ACA—positive or negative—are not restricted to financial health, we offer suggestive early evidence that the Medicaid expansion is fulfilling the goal of health insurance: providing “peace of mind” by protecting against financial hardship. Future decisions by states to expand or curtail Medicaid coverage will yield additional evidence on the financial impact of health insurance. As more data become available, it will be useful to investigate these dynamics and to compare the benefits of expanded Medicaid coverage with its associated costs.
Disclaimer
The views expressed in this post are those of the authors and do not necessarily reflect the position of the Federal Reserve Bank of New York or the Federal Reserve System. Any errors or omissions are the responsibility of the authors.

Nicole Dussault is a senior research analyst in the Federal Reserve Bank of New York’s Research and Statistics Group.

Maxim L. Pinkovskiy is an economist in the Bank‘s Research and Statistics Group.
 Basit Zafar is a research officer in the Bank’s Research and Statistics Group.
How to cite this blog post:
Nicole Dussault, Maxim L. Pinkovskiy, and Basit Zafar, “Is Health Insurance Good for Your Financial Health?,” Federal Reserve Bank of New York Liberty Street Economics (blog), June 6, 2016, http://libertystreeteconomics.newyorkfed.org/2016/06/is-health-insurance-good-for-your-financial-health.html.


 RSS Feed
 Follow Liberty Street Economics