Profits and employment in the oil and natural gas extraction industry have fallen significantly since 2014, reflecting a sustained decline in energy prices. In this post, we look at how these tremors are affecting banks that operate in energy industry–intensive regions of the United States. We find that banks in the “oil patch” have experienced a significant rise in delinquencies on commercial and industrial loans. So far though, there appears to be limited evidence of spillovers to other types of loans and no evidence of widespread bank losses or failures in these regions.
The oil and gas sector boomed as the United States emerged from the Great Recession, driven by high energy prices as well as the increased use of new extraction technologies such as hydraulic fracturing (“fracking”). Oil and gas prices have declined dramatically since 2014, however, causing losses, layoffs, and some bankruptcies among oil and gas firms. It is worth remembering that low oil prices in the late 1980s contributed to the failure of hundreds of banks in Texas and other parts of the Southwest. Could this happen again?
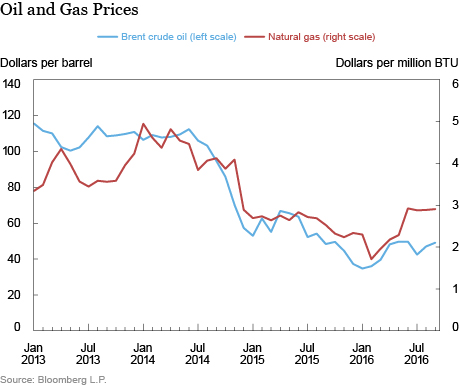
One recent analysis estimates that large banks have more than $140 billion in unfunded credit lines to energy companies in the syndicated loan market, and highlights the risk of losses if stressed energy firms draw upon those lines. By contrast, in this post we focus on the effects of lower energy prices on smaller banks located in geographic areas with a high share of oil and gas employment. Our analysis builds on a recent post on this blog that found evidence of a rise in mortgage and auto loan delinquencies in oil- and gas-dependent counties, defined as those counties with at least 6 percent of employment in mining, quarrying, and oil and gas extraction. We use this same definition but study the effects on banks, rather than households.
We measure the geographic footprint of a bank using the Federal Deposit Insurance Corporation (FDIC) summary of deposits data, which report deposits at each branch and office of FDIC-insured institutions. Using these data, we categorize as “energy-sensitive” those banks that have at least 25 percent of deposits held in oil- and gas-dependent counties. The banks may be exposed to oil and gas because they lent directly to local oil and gas firms or indirectly to companies that service the oil and gas sector. Lower energy prices may also lead to rising local consumer or mortgage defaults because of higher unemployment or lower home prices. And bank revenues may also be affected—for example, fee income may drop as loan origination volumes decline.
We use data from the banks’ quarterly Consolidated Reports of Condition and Income (“Call Reports”) to compare the performance of energy-sensitive banks with that of similar banks not located in energy-dependent regions. (The Call Reports do not break out banks’ exposures by industry, which is one reason we focus on geography.) To ensure that our analysis is “apples to apples,” we construct two comparison groups of smaller banks, one comprising all banks with assets less than $5 billion, the other made up of “nearest neighbor” banks, matched based on size and region. Specifically, for each energy-sensitive bank, we identify the four non-sensitive banks headquartered in the same census division that are closest in terms of total assets. The energy-sensitive bank group and two comparison groups are determined based on information in the first quarter of 2013, and held fixed over time.
The chart below looks at the ratio of nonperforming commercial and industrial (C&I) loans to total C&I loans for the three groups. Nonperforming loans are those that are ninety days or more past due or classified as nonaccrual. The nonperforming loan ratio is a good measure of the health of a bank’s loan portfolio.
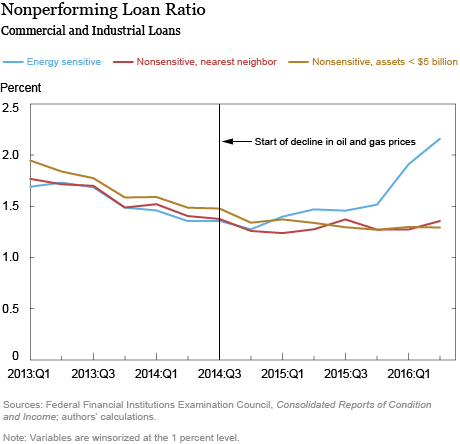
In 2013 and early 2014, when oil prices were high and stable, the nonperforming loan ratio is improving for all three groups, a reflection of the recovering U.S. economy. Once the oil and gas price slump begins in mid-2014, however, loan performance for the energy-sensitive group of banks begins to deteriorate relative to both comparison groups. By the second quarter of 2016, the nonperforming loan share is more than fifty percent higher for banks located in oil and gas regions.
Spillovers?
There are also hints of spillovers to the performance of other types of loans, although the effects seem smaller than for C&I loans. The chart below plots the nonperforming loan ratio for residential real estate, commercial real estate, consumer, and other loans. In three of the four categories, the nonperforming loan ratio has increased for oil- and gas-sensitive banks relative to the nearest-neighbor group; for the fourth category, commercial mortgages, the difference has stayed roughly constant. But the level of nonperforming loans still isn’t much higher for the energy-sensitive banks, in any category.
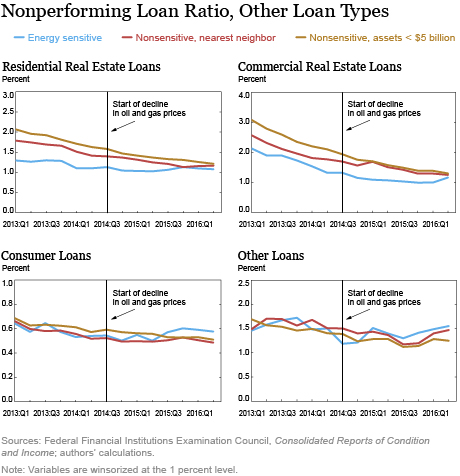
There are a number of possible reasons why the deterioration in loan performance is more pronounced for commercial and industrial loans. First, it may take time for lower oil and gas employment to affect consumers or property prices. Second, in some categories, banks may have reduced their exposure to the local economy by securitizing mortgages or selling loans to other parties outside the region. And third, the resilience of other industries may offset the effect of a weaker oil and gas sector on the local economy, or consumers may be able to adjust in other ways (such as by moving to find employment in other areas) rather than defaulting.
Effects on Overall Profitability and Capitalization
Our final chart shows that lower energy prices have had only a modest effect on banks’ profitability and capital adequacy. Before the drop in oil prices, oil- and gas-sensitive banks were significantly more profitable (as measured by return on assets) than the comparison groups, probably reflecting the boom from high oil and gas prices and the growth in fracking. Since mid-2014, their return on assets has converged toward the two comparison groups, but apparently not below them. The oil- and gas-dependent banks also appear better capitalized than either comparison group, at least based on regulatory measures of capital. Finally, there has not, as yet, been a wave of bank failures linked to low oil and gas prices—only five banks have failed so far in 2016, and eight failed in 2015, significantly below historical averages.
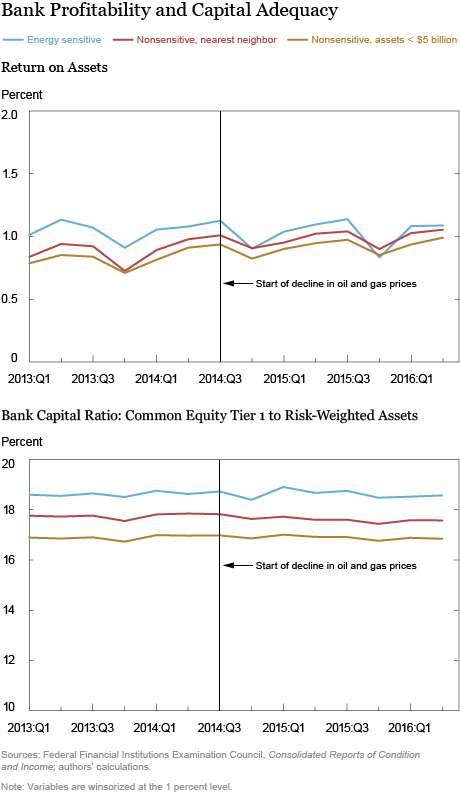
One caveat to these results is that we are using a somewhat crude (sorry for the pun) measure of exposure to the oil and gas sector—for example, banks do not necessarily have to lend where their branches and deposits are located, and even a geographically diversified bank may have significant exposure to the energy sector. And our measure only works reliably for small banks, not the large banks that are most important for overall financial stability. Even so, our evidence seems to back up the view that to date, the banking sector has successfully weathered the storm of low energy prices.
Summing Up
While small banks located in oil- and gas-intensive regions of the United States are indeed experiencing a rise in nonperforming loans to businesses, so far there is little evidence of a widespread effect on bank performance or a repeat of the 1980s-era wave of bank failures linked to low oil prices. One important change since then is that our banking system is now much more geographically diversified, owing to the removal of restrictions against interstate banking and branching. Recent research finds that geographic diversification across states does make banks safer, reducing their exposure to sector-specific shocks—such as those from the energy sector. Even so, further analysis and continued monitoring of the effect of lower oil and gas prices on the banking system is warranted going forward.
Disclaimer
The views expressed in this post are those of the authors and do not necessarily reflect the position of the Federal Reserve Bank of New York or the Federal Reserve System. Any errors or omissions are the responsibility of the authors.
James Vickery is an assistant vice president in the Federal Reserve Bank of New York’s Research and Statistics Group.
Lauren Thomas is a former undergraduate intern in the Bank’s Research and Statistics Group.

Ulysses Velasquez is a senior research analyst in the Bank’s Research and Statistics Group.
How to cite this blog post:
James Vickery, Lauren Thomas, and Ulysses Velasquez, “Are Banks Being Roiled by Oil?” Federal Reserve Bank of New York Liberty Street Economics (blog), October 24, 2016, http://libertystreeteconomics.newyorkfed.org/2016/10/are-banks-being-roiled-by-oil.html.



 RSS Feed
 Follow Liberty Street Economics