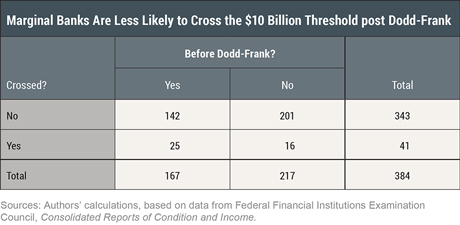
Update (10.3.16). When this post was published earlier today, the first and second column heads of the table were reversed. We have corrected the column heads and clarified the associated text.
Ten billion has become a big number in banking since the Dodd-Frank Act of 2010. When banks’ assets exceed that threshold, they face considerably heightened supervision and regulation, including exams by the Consumer Financial Protection Bureau, caps on interchange fees, and annual stress tests. There are plenty of anecdotes about banks avoiding the $10 billion threshold or waiting to cross with a big merger, but we’ve seen no systematic evidence of this avoidance behavior. We provide some supporting evidence below and then discuss the implications for size-based bank regulation—where compliance costs ratchet up with size—more generally.
What Changes at $10 Billion?
Quite a lot. First, banks face an entirely new regulator: the Consumer Financial Protection Bureau (CFPB). The agency enforces nineteen consumer protection regulations (such as the Truth in Lending Act) and has rule-writing authority of its own. The CFPB’s examiner manual is 924 pages, which gives some indication of the scale and scope of the exams.
Second, banks above the $10 billion mark face a cap on the interchange fees they charge merchants when shoppers use their debit cards. Imposed by the Fed in 2011, the cap limits debit fees to $0.21 plus 0.05 percent of the transaction value, about half the average fee before. The cap saves merchants and customers (presumably), but costs banks; a study by Fed economists estimated that banks above $10 billion lose about $10 billion a year in aggregate income because of the cap, even allowing for potentially offsetting increases in other fees.
Lastly, banks with assets exceeding $10 billion for four consecutive quarters must conduct annual Dodd-Frank Act stress tests, which involve forecasting revenue, losses, capital, and other key variables under alternative macroeconomic scenarios, including adverse scenarios, provided by their primary supervisor. In addition to shouldering the cost of running the tests, banks have to publicly disclose their stress results.
It’s difficult to figure the total cost to banks of complying with these requirements, but it’s surely “nontrivial” (as mathematicians say). Is it nontrivial enough to change banks’ behavior?
Banks Are Bunching under $10 Billion
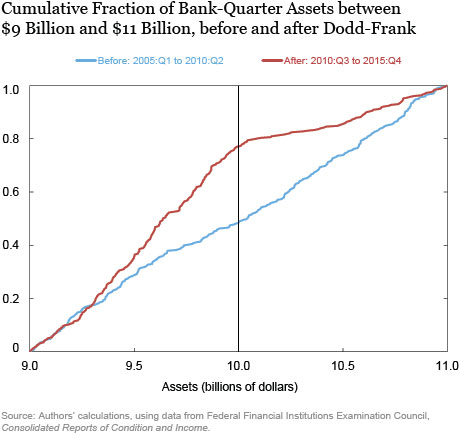
The chart below plots the cumulative distribution of bank-quarter assets (assets of a given bank in a given quarter) in the $9 billion to $11 billion range over the roughly five years before and after the passage of the Dodd-Frank Act. The distribution was roughly linear before (blue line), with about half of bank-quarters (48 percent) under $10 billion, but after Dodd-Frank (red line), it twists upward before crossing the $10 billion mark, with about three-fourths of the observations (77 percent) under $10 billion. We can reject with 99 percent confidence that the distributions are the same (based on a Kolmogorov-Smirnov test). We didn’t find such a shift in the distributions in the $7 billion to $9 billion range or the $11 billion to $13 billion range.

Said Differently . . .
The table below makes the same point numerically. We classified the banks in each quarter with assets of at least $9 billion but just under $10 billion into four categories: before and after Dodd-Frank and whether or not they crossed the $10 billion threshold for the next four consecutive quarters. Before Dodd-Frank, about 15 percent (25/167) of crossover candidates actually crossed. After Dodd-Frank, only about 7 percent (16/217) crossed. We confirmed using a logit probability model that the odds of a marginal bank (one with assets just under $10 billion) crossing the $10 billion mark for four consecutive quarters were significantly lower at the 95 percent confidence level after Dodd-Frank.

What about $50 Billion and $250 Billion?
Dodd-Frank mandated a number of other size thresholds that trigger additional regulation or supervision. Bank holding companies (BHCs) with more than $50 billion in assets are subject to heightened supervision by the Fed that includes risk-based capital, leverage, and liquidity requirements, stress tests, and annual resolution plans (“living wills”). At the $250 billion threshold, additional regulations kick in, mainly in the form of stricter capital and liquidity requirements. In this testimony, Fed Governor Tarullo explains how the Fed has tailored supervision and regulation around the various Dodd-Frank size thresholds.
There are also anecdotes about BHCs hovering below these higher thresholds or waiting to cross them with a big merger, but with only a handful of BHCs near the thresholds, we were not able to find any systematic evidence one way or the other.
Bug or Feature?
The implications of this “fear of $10 billion” (supposing it’s not merely temporary until banks can cross with a big merger) seem ambiguous. When threshold effects are found in other contexts, such as environmental regulation, researchers sometimes call them an unintended consequence of size-based regulation. But systemic risk and the problem of too big to fail can increase with size (plus other factors), so size itself—beyond a point—is problematic. Furthermore, size-based regulation might be a more efficient way to limit bank size and systemic risk than blunter alternatives. Former Fed Governor Jeremy Stein conjectured as much in a speech he made while still a governor:
In other words, let’s simply posit that a goal of regulation should be to lean against bank size, and ask: What are the best regulatory tools for accomplishing that goal? As in many other regulatory settings, this question can be mapped into the “prices-versus-quantities” framework. . . . Here a size cap is a form of quantity regulation, whereas capital requirements that increase with bank size can be thought of as a kind of price regulation, in the sense that such capital requirements are analogous to a progressive tax on bank size.
Stein was referring to capital requirements, but the point can be extended to other size-based regulations. Of course, $10 billion banks are not considered systemically important, but our evidence at that threshold is consistent with the notion that size-based regulation might “lean against size” at higher thresholds.
Disclaimer
The views expressed in this post are those of the authors and do not necessarily reflect the position of the Federal Reserve Bank of New York or the Federal Reserve System. Any errors or omissions are the responsibility of the authors.

Donald P. Morgan is an assistant vice president in the Federal Reserve Bank of New York’s Research and Statistics Group.

Bryan Yang is a senior analyst in the Federal Reserve Bank of New York’s Markets Group. He was a senior research analyst in the Research and Statistics Group at the time the post was written.
How to cite this blog post:
Donald P. Morgan and Bryan Yang, “Fear of $10 Billion,”
Federal Reserve Bank of New York Liberty Street Economics (blog), October 3, 2016, http://libertystreeteconomics.newyorkfed.org/2016/10/fear-of-10-billion.html.


 RSS Feed
 Follow Liberty Street Economics