Oil prices plunged 65 percent between July 2014 and December of the following year. During this period, the yield spread—the yield of a corporate bond minus the yield of a Treasury bond of the same maturity—of energy companies shot up, indicating increased credit risk. Surprisingly, the yield spread of non‑energy firms also rose even though many non‑energy firms might be expected to benefit from lower energy‑related costs. In this blog post, we examine this counterintuitive result. We find evidence of a liquidity spillover, whereby the bonds of more liquid non‑energy firms had to be sold to satisfy investors who withdrew from bond funds in response to falling energy prices.
Corporate Fundamentals, Oil Prices, and Credit Risk
Oil prices may affect the credit risk of firms via their profit margins—earnings divided by revenues—and leverage. Lower oil prices reduced the revenues and profits of firms with energy‑related products, and increased the leverage of those firms as they borrowed more to maintain operations. In turn, higher leverage and reduced profitability are expected to increase credit risk. These linkages are likely to be more pronounced for firms in energy‑related businesses as compared with non‑energy firms whose businesses are less affected by oil prices.
We measure credit risk by the yield spread on high-yield (HY) bond indexes of energy and non‑energy firms, adjusted for special features of the bonds—such as the firm’s option to call the bond before its maturity. Yield spreads of HY bonds represent, to a large extent, the additional credit risk of the corporate bond relative to a Treasury bond. We calculate the leverage and profits of individual firms in the energy and non‑energy indexes, respectively, and use the median value to represent the fundamentals of a typical firm in the index.
To understand what drives the yield spreads of energy and non‑energy firms, we regress changes in the yield spread indexes on changes in firm fundamentals (leverage and profits), equity volatility, macroeconomic indicators and oil prices. Higher equity volatility, all else equal, implies higher bond default risk. The macroeconomic indicators are the ISM composite index, inflation, unemployment claims, the Treasury term spread measured as the ten‑year minus two‑year Treasury rates, and the three‑month Treasury bill rate.
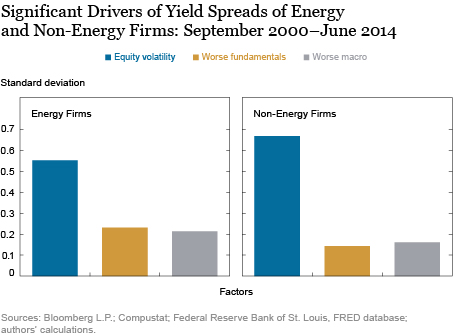
The chart below shows the relative importance of the statistically significant drivers of the yield spread from September 2000 to June 2014, the period just before the recent drop in oil prices, measured in standard deviations (SD) of the yield spreads. For all firms, volatility is the biggest driver of yield spreads: a one SD increase in volatility increases yield spreads by 0.6 SD or more. Worse macro indicators (that is, lower production and higher unemployment) and firm fundamentals (higher leverage and lower profitability) also increase yield spreads. Notably, oil price changes are not a statistically significant determinant of yield spread changes during this period, even for energy firms.

Credit Risk and Oil Prices since July 2014
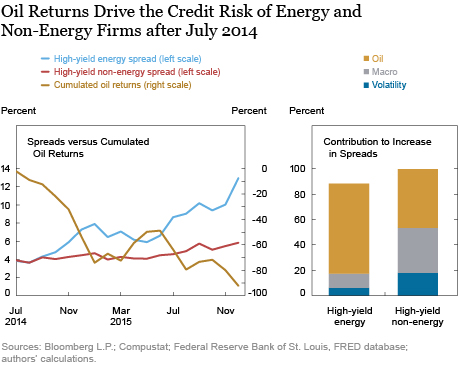
From July 2014 to December 2015, HY spreads moved closely with oil prices (see the left panel of the chart below). Did oil prices influence yield spreads more in this recent period? Indeed, the regression shows that for energy firms, oil returns explain more than 70 percent of the yield spread increase since July 2014 (see the right panel of the chart below). Thus, oil prices went from being an insignificant factor in the prior period to the dominant driver of yield spreads of energy firms in the recent period. Also surprising is that oil returns explain close to one‑half of increases in yield spreads of non‑energy firms.

The large contribution of oil returns to HY non‑energy spread increases since July 2014 is a puzzle since these firms constitute a diversified group of sectors, many of which should benefit from lower oil prices. One explanation is that sharply lower oil prices may result in investors becoming more risk averse in general, lowering all asset prices. However, even after including measures of investor risk premium in our regression, oil returns remain the dominant factor in explaining changes in yield spreads.
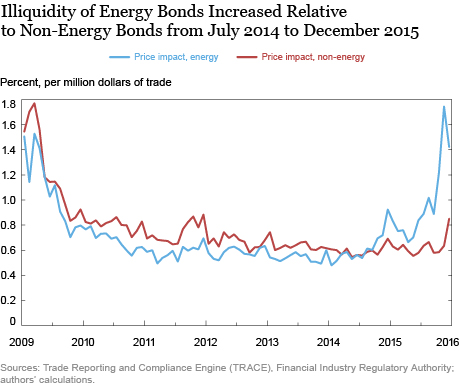
Another explanation is related to the higher illiquidity of energy bonds, as measured by the price impact (in percent) per $1 million of bond trades, relative to non‑energy bonds following oil price declines (see the chart below). When oil prices fell, bond mutual funds facing redemptions from energy‑sector investors may have found it easier to sell the more liquid non‑energy bonds, thus driving up the yield spreads of those bonds.

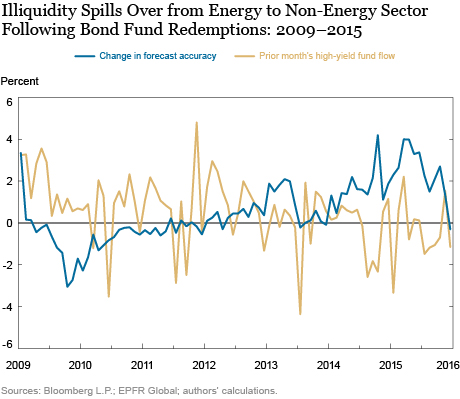
Lacking data on the ownership of individual bonds by mutual funds, we cannot measure spillovers directly. As an alternative, we test whether, after July 2014, the current illiquidity of energy bonds predicts the future illiquidity of non‑energy bonds, as the liquidity spillover story implies. We use the first principal component (that is, an index) of the price impact of bond trades and the number of trades as our illiquidity measure. Then, we make two forecasts of non‑energy bond illiquidity for 2009–15 using data from 2002–08, first with its own lagged values, and then adding lagged values of energy bond illiquidity. The chart below shows the difference between the accuracies of the two forecasts. Prior to 2014, forecast accuracy decreased when information about energy bond illiquidity is incorporated, but the opposite has been true since 2014. Moreover, forecast accuracy generally increased when the prior month’s flows were more negative—in other words, there were more investor redemptions.

We find in the regression that, since July 2014, increased liquidity spillovers imply higher non‑energy spreads but only after months of substantial investor redemptions. Moreover, oil returns are no longer a significant driver of non‑energy spreads after accounting for the interaction of spillovers and past flows. In other words, non‑energy bond prices were likely responding to selling pressures on energy bonds rather than increased perceptions of credit risk.
Implications for the Corporate Bond Market
Recent research has shown that a risk event in a narrow sector of the corporate bond market may have broader impacts. For example, the downgrades of Ford and General Motors generated significant liquidity risk for corporate bond market-makers generally. And, following the announced liquidation of Third Avenue’s HY Focused Credit Fund on December 10, 2015, the bonds most exposed to this risk had higher yield spreads and lower liquidity. We add to the evidence by suggesting a possible illiquidity spillover from energy bonds to non‑energy bonds following the recent oil price declines that resulted in higher yield spreads for non‑energy companies.
The high correlation of oil returns and the yield spreads of energy firms in the recent period is another puzzle given the absence of such a correlation in the historical data. However, after decomposing oil returns into aggregate demand and supply‑side factors, we find that when lower oil prices reflect weak aggregate demand, higher credit risk may result. In the recent period since July 2014, the supply component of oil returns has also been driving changes in credit risk. It may be that falling oil prices, even if due to supply conditions, affect global financial conditions via their adverse impact on oil companies.
Disclaimer
The views expressed in this post are those of the authors and do not necessarily reflect the position of the Federal Reserve Bank of New York or the Federal Reserve System. Any errors or omissions are the responsibility of the authors.

Brandon Li is a senior analyst in the Federal Reserve Bank of New York’s Markets Group.

Asani Sarkar is an assistant vice president in the Bank’s Research and Statistics Group.
How to cite this blog post:
Brandon Li and Asani Sarkar, “Why Did the Recent Oil Price Declines Affect Bond Prices of Non-Energy Companies?,” Federal Reserve Bank of New York Liberty Street Economics (blog), October 5, 2016, http://libertystreeteconomics.newyorkfed.org/2016/10/why-did-the-recent-oil-price-declines-affect-bond-prices-of-non-energy-companies.html.


 RSS Feed
 Follow Liberty Street Economics