Debt in China has increased dramatically in recent years, accounting for roughly one-half of all new credit created globally since 2005. The country’s share of total global credit is nearly 25 percent, up from 5 percent ten years ago. By some measures (as documented below), China’s credit boom has reached the point where countries typically encounter financial stress, which could spill over to international markets given the size of the Chinese economy. To better understand the associated risks, it is important to examine the drivers of China’s expansion in credit, the increasing complexity of its financial system, and evidence that its supply of credit may be growing more rapidly than reported. Note, however, that there are several features of China’s financial system that reduce the threat of a financial disruption.
Nonfinancial debt in China has increased from roughly $3 trillion at the end of 2005 to nearly $22 trillion, while banking system assets have increased sixfold over the same period to over 300 percent of GDP. In 2016 alone, credit outstanding increased by more than $3 trillion, with the pace of growth still roughly twice that of nominal GDP. As a result, the “credit-to-GDP gap”—the difference between the debt-to-GDP ratio and its long-run trend—has reached almost 30 percentage points. The international experience suggests that such a rapid buildup is often followed by stress in domestic banking systems. Roughly one-third of boom cases end up in financial crises and another third precede extended periods of below-trend economic growth.
Drivers of China’s Credit Growth
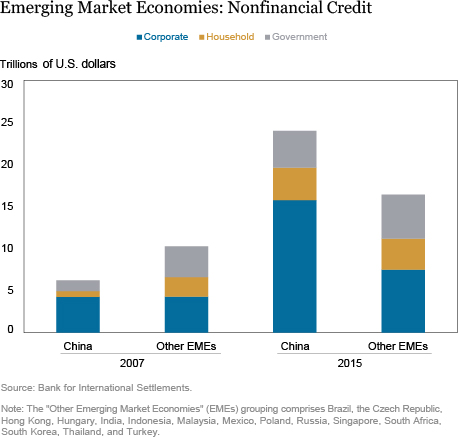
As seen in the chart below, rising nonfinancial sector debt was driven initially by a surge in corporate borrowing in response to the global financial crisis. This additional debt was comprised mostly of medium- and long-term corporate loans related to infrastructure and property projects.

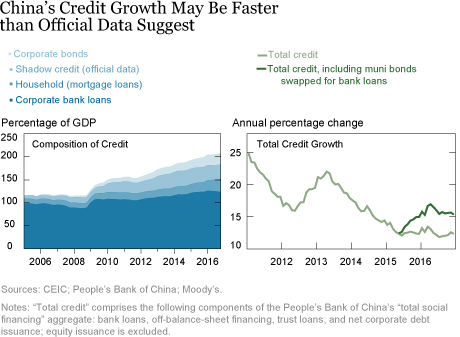
The chart below shows that while bank lending is the largest component of China’s credit boom, nontraditional or “shadow” credit has also grown rapidly. Nonbanks, often in cooperation with banks, have found ways around authorities’ efforts to restrict lending to certain sectors (such as real estate and industries with excess capacity like steel and cement) following the initial surge in credit in 2009. This shadow credit (in the form of trust loans, entrusted lending, and undiscounted bankers’ acceptances) is included in official data and accounts for about 15 percent of total credit—31 percent of GDP—compared with 5 percent ten years ago. Authorities have slowed the growth in reported shadow lending since 2013 through macroprudential measures, although this may have caused credit to migrate to other lending channels.
More recently, rapid mortgage lending has been a key driver of credit growth, with residential mortgage loans increasing by 35 percent year over year at the end of December 2016. Mortgages account for roughly 18 percent of bank loans in China (compared to 30 percent in South Korea, 23 percent in Japan, and 25 percent in the United States). The pace of mortgage lending appears likely to slow going forward as Chinese authorities tighten macroprudential policy on property-related lending.
The increasing complexity of China’s financial system has made it difficult to estimate the true level and growth rate of credit. Official data put nonfinancial debt at roughly 205 percent of GDP. However, adjustments for additional sources of credit not fully captured in the official data suggest total credit could be higher. As shown in the chart below, the pace of total credit growth is higher when swaps of local government-related bank loans for municipal bonds are included. China’s credit measure excludes swapped bank loans but does not add back the municipal bonds they were exchanged for.

Smaller Banks Increasingly Reliant on Nondeposit Borrowing
Chinese banks have become global behemoths. The country is home to four of the five largest banks in the world by asset size. Yet, China’s credit expansion has been driven by relatively small banks, which have been growing their total assets at two to three times the pace of the largest commercial banks.
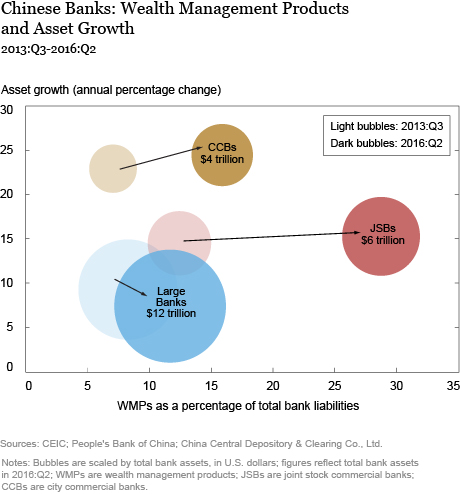
Joint stock commercial banks (JSBs), city commercial banks (CCBs), and other smaller-scale institutions have increasingly used less stable funding sources to finance their balance sheet expansion, primarily by tapping the interbank market and issuing wealth management products (WMP), as seen in the chart below. WMPs are predominantly short-term investment products sold by banks and nonbank financial institutions that provide investors with higher rates of return than bank deposit rates. WMPs can have a range of underlying assets, including bonds, money market funds, and even a limited amount of bank loans. Official data on banks’ WMPs show an almost sixfold increase since 2011, to the equivalent of about $4 trillion or 37 percent of GDP. The growing reliance of Chinese banks on this type of funding has increased concerns over potential shocks to market-based funding, a risk highlighted by the International Monetary Fund in its October 2016 Global Financial Stability Report.

Credit Offers Less Boost to Growth
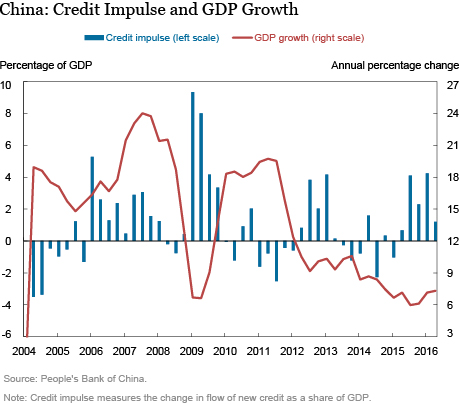
An interesting development is that credit appears to be providing less of a boost to Chinese GDP growth than it used to. As shown in the chart below, the credit impulse—the change in the flow of new credit as a percentage of GDP—appears to be providing less bang to output for each additional yuan of credit, underscoring questions over how much lending is going to unproductive “zombie” companies. Improving credit efficiency going forward will require reforms, such as hardening budget constraints at state-owned enterprises and local governments, reducing implicit and explicit guarantees in the financial system, and slowing aggressive balance sheet growth at smaller financial institutions.

Features That Reduce the Risk of a Financial Disruption
Despite its vulnerabilities, China’s financial system has several features that reduce the associated risks.
- Unlike many emerging-market credit booms that have ended in busts, China’s credit growth has been funded primarily by high domestic saving, of which bank deposits are the vast majority.
- Chinese authorities have ample liquidity tools, including high required reserve ratios, the ability to extend short-term liquidity via an array of facilities, and a financial sector dominated by state-owned lenders and borrowers.
- By some measures, the Chinese financial system has a smaller nonbank segment than its counterparts in advanced economies do.
- China has substantial fiscal resources to address losses in its financial system and among troubled state-owned debtors. According to IMF projections, China’s total government gross debt (including off-balance-sheet borrowing implicitly guaranteed by the state) was around 60 percent of GDP at the end of 2016—lower than the level seen in most advanced economies. The government’s balance sheet is further bolstered by sizeable, albeit declining, foreign exchange reserves.
This last consideration is very important; the Chinese government’s strong balance sheet should give it sufficient capacity to absorb potential losses from a financial disruption. Still, the speed and increasing complexity of the country’s credit growth suggest that there could be significant benefits for China in addressing its banking system and financial reforms.
Disclaimer
The views expressed in this post are those of the authors and do not necessarily reflect the position of the Federal Reserve Bank of New York or the Federal Reserve System. Any errors or omissions are the responsibility of the authors.

Jeff Dawson is an officer in the Federal Reserve Bank of New York’s Research and Statistics Group.

Alex Etra is an associate in the Bank’s Executive Office.

Aaron Rosenblum is a senior analyst in the Bank’s Research and Statistics Group.
How to cite this blog post:
Jeff Dawson, Alex Etra, and Aaron Rosenblum, “China’s Continuing Credit Boom,” Federal Reserve Bank of New York Liberty Street Economics (blog), February 27, 2017, http://libertystreeteconomics.newyorkfed.org/2017/02/chinas-continuing-credit-boom.html.


 RSS Feed
 Follow Liberty Street Economics
Thank you for your comment. In the context of features that reduce the risk of financial disruption, China’s credit growth has been funded primarily by high domestic saving, of which bank deposits—traditionally a more stable funding source—have been the vast majority. Many emerging-market credit booms that have ended in busts have been funded via less stable external borrowing and/or wholesale funding, although the latter has increased notably in China in recent years, as is noted in the post.
Can you please elaborate on the connection between ‘high domestic savings’ and credit growth?