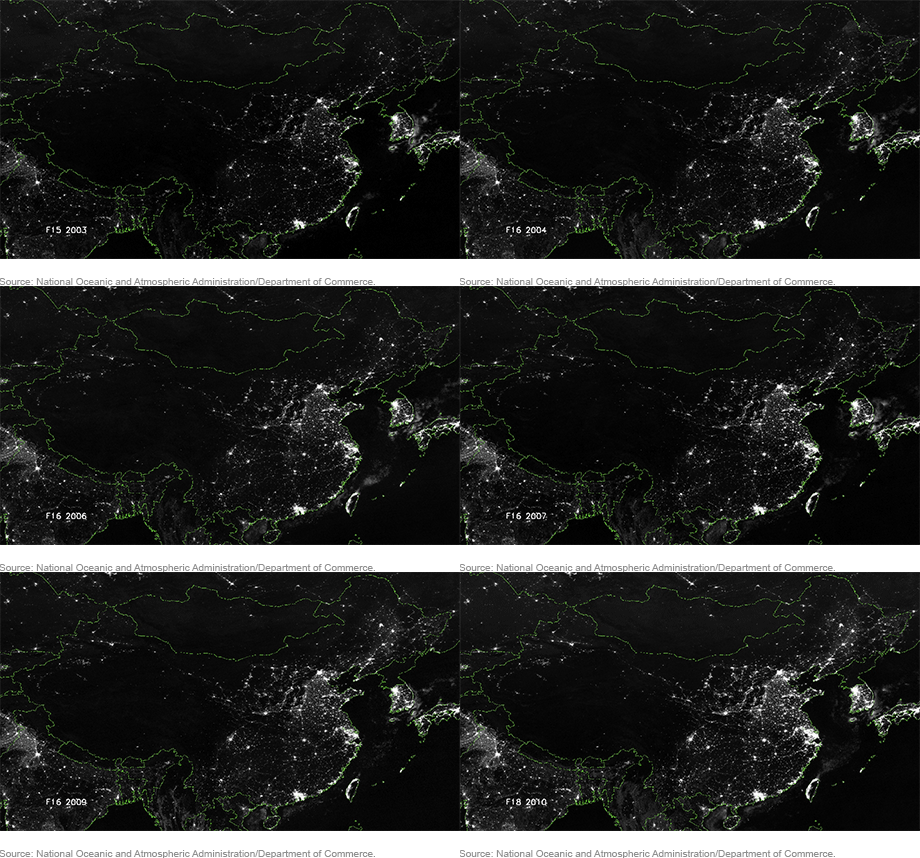
For analysts of the Chinese economy, questions about the accuracy of the country’s official GDP data are a frequent source of angst, leading many to seek guidance from alternative indicators. These nonofficial gauges often suggest Beijing’s growth figures are exaggerated, but that conclusion is not supported by our analysis, which draws upon satellite measurements of the intensity of China’s nighttime light emissions—a good proxy for GDP growth that is presumably not subject to whatever measurement errors may affect the country’s official economic statistics.
Doubts about the Data
In the eyes of many observers, China’s economy seemed to be entering a tailspin in 2015, with a stock market crash in June followed by a surprise currency devaluation in August. And yet, the official GDP data showed growth slowing hardly at all, ticking down to 6.8 percent at the end of the year from 7.2 percent in 2014. The financial press pounced on these “questionable” statistics, often citing a now-famous 2007 exchange between Premier Li Keqiang, then the Communist Party secretary of Liaoning Province, and U.S. Ambassador Clark Randt. Li admitted that he preferred to assess the state of Liaoning’s economy by averaging the growth rates of electricity production, rail freight, and bank loans, adding that official statistics were “man-made” and “for reference only.”
Li’s metric—since dubbed the “Li Keqiang index”—has declined for four of the past six years, recording an especially precipitous drop in 2015. Such signals have prompted many observers to believe the Chinese economy is weaker than official statistics portray it to be (notwithstanding the fact that the index rose over the course of 2016).
Skeptical of the official numbers, many Wall Street analysts have constructed their own models of Chinese economic growth, combining elements of the Li Keqiang index with statistics on retail sales, construction, and other types of activity. Many of these measures suggested that Chinese economic growth in the last quarter of 2015 was indeed much lower than the official rate of 6.8 percent—with the “true” figure often claimed to be less than 5 percent, or even below 3 percent.
Imperfect Alternatives
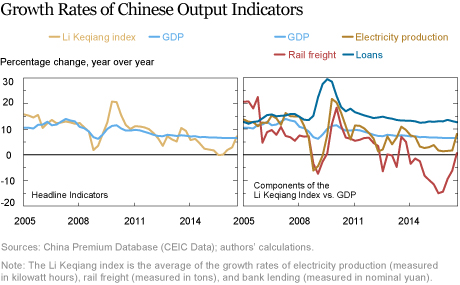
These nonofficial indexes are all based on assumptions about and models of the Chinese economy that are difficult to express, let alone test. Each model implies a particular set of weightings for a particular set of economic indicators, and changing these parameters would have profound implications. As the chart below shows, the components of the Li Keqiang index—the growth rates of electricity production, rail freight, and bank loans—have followed separate trajectories over the past twelve years. Placing greater weight on any of these inputs would produce a much different stream of GDP growth estimates.

We see that the growth rate of bank loans has been very stable over time, hovering around 12-13 percent year over year, except during the financial crisis of 2008 and its immediate aftermath. Meanwhile, the rail freight growth series has shown a sustained decline over the past twelve years, reaching a low point in December 2015. This precipitous deceleration was one reason that market participants a year ago were so concerned that official statistics were not reflecting the true state of the Chinese economy. However, there are more innocuous explanations for the decline of rail freight growth, such as the structural transition of the Chinese economy from heavy industry toward services.
In light of the structural changes under way in the Chinese economy, we might devise a modified Li Keqiang index, placing more weight on the bank loans series than on the rail freight series (instead of weighting the three growth rate series equally). This approach would have sparked much less cause for concern at the end of 2015. But what weightings would be statistically sound? And, more fundamentally, how can we tell what the best set of weightings would be?
Satellite Readings
To resolve these issues, we need to develop a transparent, data-driven procedure centered on an independent gauge of Chinese economic growth—one whose measurement error is unrelated to those associated with the components of the Li Keqiang index. We argue that such an independent measure exists in the form of satellite-recorded data on the brightness of nighttime lights across Chinese provinces over time. It has been well established that growth in nighttime light intensity is a good proxy for economic growth. By gauging how well changes in different economic variables correlate to fluctuations in nighttime light intensity, we can see which series are more reliable as growth indicators.
The task of measuring the relationship between nighttime light intensity and true unobserved economic output is complicated by weather and atmospheric disturbances, both of which affect how light is captured by orbiting satellites. These errors are plausibly unrelated to those that dog conventional statistical measures, which are subject to systematic reporting errors by people and businesses, mistaken decisions by statistical agencies, or, in some cases, outright manipulation by government officials or economic actors. Hence, nighttime lights are useful as an “independent referee” to determine the quality of conventional statistical series.
The heart of our analysis—as detailed in our recent NBER paper—is a regression of growth in nighttime lights across Chinese provinces and over time on the growth rates of the various statistical series used to calculate the Li Keqiang index and the various indices devised by Wall Street analysts. Under our key assumption—that measurement errors in nighttime lights are independent of the measurement errors of the other variables utilized—the regression coefficients we obtain on the statistical series are proportional to the optimal weights that should be applied to these measures in order to derive predictions for true Chinese GDP growth.
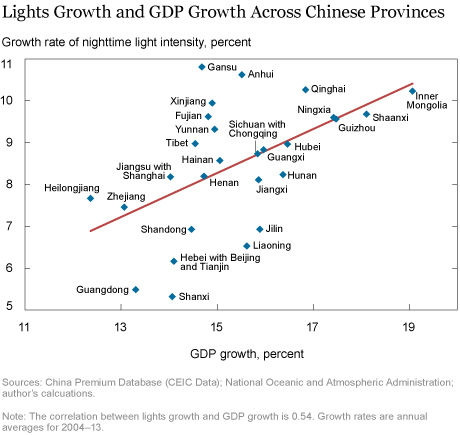
This hypothesis holds for a variety of possible interrelationships between true GDP growth and nighttime lights growth. In particular, as long as true GDP growth and nighttime lights growth are correlated, we can allow this correlation to change over time or vary across different areas of China. The correlation between official GDP growth and nighttime lights growth is documented in the scatter plot below. Our regression also includes flexible factors that absorb any nationwide changes in nighttime light intensity (or economic growth). For example, if Chinese lighting technology changed during the time period of our analysis, leading to a proportional brightening of all Chinese lights, the weightings we derive for the components of our new GDP growth proxy would not be affected.

Reweighting the Li Keqiang Index
We find that the components of the Li Keqiang index should not be assigned equal weighting, as is typically supposed. In fact, our analysis indicates that bank loan growth should be given six to eight times more weight than rail freight growth, with the optimal weighting on electricity production growth somewhere in between. Under additional assumptions (specifically, if we normalize our proxy to match the level and trend of official Chinese GDP growth before 2012), the implications of this reweighting on our optimal estimate of Chinese GDP growth are profound. We find that since 2012, our estimate of Chinese GDP growth was never appreciably lower, and was in many years higher, than the GDP growth rate reported in the official statistics. Adding other series besides those incorporated in the Li Keqiang index does not change our results.
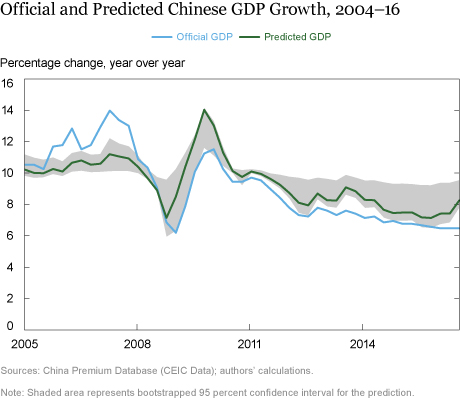
The chart below presents the path of official Chinese GDP growth alongside our modified Li Keqiang index (with the weights determined by the nighttime lights regression). We place a 95 percent confidence interval around our prediction.

Looking back at the prediction for the end of 2015, we can reject the dire growth-collapse scenarios that were suggested by some of the Wall Street indices at the time, with it being very unlikely that the true growth rate of China was much below 6 percent. On the contrary, while we generally can’t reject that the official growth estimates are correct, we also can’t reject that they have understated Chinese growth since 2012, with the true level being closer to the average seen in the 2005-12 period. Our results are consistent with work by Rosen and Bao, who argue that Chinese statistical services have chronically underestimated the size of the service sector. Rosen and Bao’s hypothesis is consistent with our finding that rail freight growth should receive less weight than the other indicators in the Li Keqiang index. Hence, as the Chinese economy becomes increasingly service-oriented, the (conventional) Li Keqiang index will likely send increasingly faulty signals about the state of China’s economy. In fact, our estimate for Chinese growth shows an appreciable acceleration in 2016, even as the official growth rate remained virtually unchanged.
It is important to understand the limitations of our analysis. While we present evidence that China’s growth was not as weak as claimed by some analysts in 2015 and is not experiencing a sharp slowdown right now, we have no way of saying whether the current pace of growth will be sustainable far into the future. The fact that bank loan growth appears to have been such a durable predictor of China’s overall economic growth raises some cause for concern. Should lending decline for some reason—if, for example, the assumptions underlying existing lending are found to be unwarranted—then the Chinese economy could experience considerable turmoil. Rather than dismissing such risks, our research simply indicates that, at present, there are few immediate indications that Chinese growth is being systematically overestimated.
Disclaimer
The views expressed in this post are those of the authors and do not necessarily reflect the position of the Federal Reserve Bank of New York or the Federal Reserve System. Any errors or omissions are the responsibility of the authors.

Hunter L. Clark is an assistant vice president in the Federal Reserve Bank of New York’s Research and Statistics Group.

Maxim L Pinkovskiy is an economist in the Bank‘s Research and Statistics Group.
Xavier X. Sala-i-Martin is the Jerome and Matthew Grossman Professor of Economics at Columbia University.
How to cite this blog post:
Hunter L. Clark, Maxim L. Pinkovskiy, and Xavier X. Sala-i-Martin, “Is Chinese Growth Overstated?” Federal Reserve Bank of New York Liberty Street Economics (blog), April 19, 2017, http://libertystreeteconomics.newyorkfed.org/2017/04/is-chinese-growth-overstated.html.


 RSS Feed
 Follow Liberty Street Economics
Kent, eychenne: Thank you very much for your interest in our work. We are currently investigating employing this technique to look at economic activity in other countries, and look forward to posting results once we have them. Unfortunately, nighttime lights are a better indicator of economic growth in developing countries rather than in developed ones. In particular, until very recently, the satellites recording the lights had a maximum sensitivity that is close to the brightness of a typical developed-world city, which limited their ability to show lights brightening and dimming with developed country business cycles.
Talley: We are still doing research using these data and will likely update the blog with links to some data series once the project is concluded. Watch this blog for updates!
Andrew: Great question. In our analysis, we control for all general national trends in China, which should capture changes such as transitions to a different lighting technology. To alleviate the concern that such technology may be adopted differentially in more urban parts of China, we can also control for trends that vary by urbanization status, which does not affect our results.
Interesting research. Have you made allowances for the fact that cost of lighting has become very low with new technology? And therefore, the propensity to deploy has gone up significantly. ab
excellent question as their population grows together with its GDP. There is a possibility for more job opportunities as their economy is growing rapidly fast. Because majority of the companies across the globe are relying on china to create their products.
So, in examining this proxy, have you compared the same type of light data against known GDP data of other countries? If so, what were your findings?
How can I gain access to the data for your re-weighted Li Keqiang Index? For example, will you publish the time series on FRED?
Hello, fantastic for China ! Does it work for other zones ? US, Euro,… Thanks for your very interesting job
Excellent question. We believe that nighttime lights are, on average, a good proxy for economic growth, but that they also have large and random fluctuations that make them inconvenient to be used directly. A better (less noisy) proxy may be an appropriate index of more precisely measured variables that captures the signal that is present in the nighttime lights data. The extra steps allow us to compute this index – essentially, what weight we should place on each variable.
Excellent work gentlemen, and very interesting. Can I ask a naive question? If light emissions are such a good proxy for economic activity….why all the other steps? Why not just use their changes to measure growth?