Personal bankruptcy is surprisingly common in the United States. Almost 15 percent of the U.S. population has filed for bankruptcy sometime over the past twenty-five years, based on my calculations using the New York Fed Consumer Credit Panel/Equifax (CCP). In 2015, roughly 800,000 debtors filed for bankruptcy, according to court records, representing 0.64 percent of U.S. households. One of the consequences for filers is a mark on their credit report—a bankruptcy “flag”—which indicates that the consumer has filed for bankruptcy.
This bankruptcy flag is visible to creditors and, according to the credit bureaus, hurts filers’ credit scores. To limit these effects, the Fair Credit Reporting Act restricts the length of time that credit bureaus can fly these flags on reports for each (personal) bankruptcy chapter: the flag for Chapter 7—in which debtors get a full discharge of (unsecured) debts after unprotected (non-exempt) assets are liquidated—must be removed after ten years, while the flag for Chapter 13—a partial debt repayment bankruptcy designed to help people keep their homes—is typically removed after seven years. For economists, the fixed timing of the flag removal (and the difference across bankruptcy chapters) gives us a laboratory to explore how the lifting of bankruptcy flags affects borrowers’ credit scores and credit outcomes, by comparing these outcomes directly before and after flag removal.
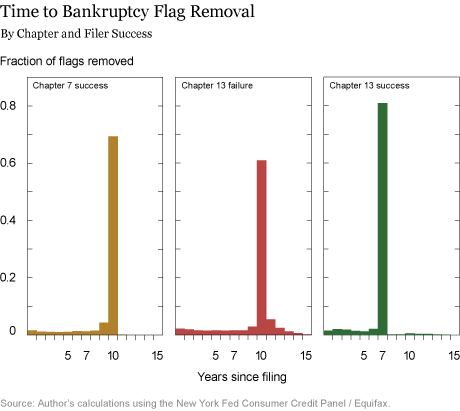
Using the CCP, I know the dates on which the filers’ flags were raised and removed, the chapter of the bankruptcy, and whether the bankruptcy was “successful.” A successful bankruptcy is defined here as one in which discharge of debt occurs. But if a consumer fails to file the correct paperwork, the bankruptcy judge rejects the petition, or, in the case of Chapter 13 bankruptcy, a consumer fails his or her debt repayment plan, I define the bankruptcy as unsuccessful. With unsuccessful bankruptcies, the bankruptcy filing remains on the filer’s credit report. I focus on those individuals whom I can track from bankruptcy filing all the way to bankruptcy flag removal. In my sample, 81 percent of individuals use Chapter 7, and almost all are successful. For the remaining 19 percent of consumers—those in Chapter 13—only 56 percent succeed. In the chart below, we see that while the vast majority of Chapter 7 flags are removed from credit reports after ten years, and successful Chapter 13 flags are removed after seven years, unsuccessful Chapter 13 bankruptcy filings are removed after ten years as well.

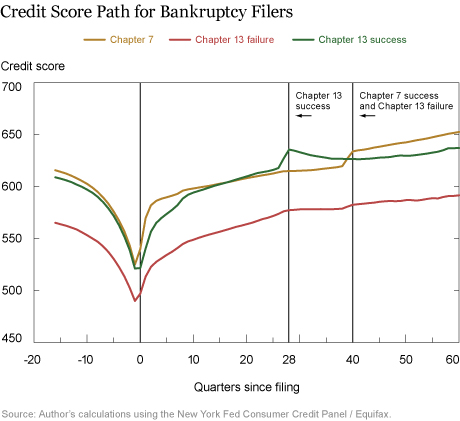
Comparing credit score dynamics for these three groups reveals some interesting behavior, shown in the chart below. All three sets of debtors see their credit scores (measured using the Equifax Risk Score) drop almost 100 points over the four years before filing, but with a partial recovery afterward. For successful Chapter 7 and Chapter 13 filers, the recovery likely stems from the successful discharge of debt—many delinquent debts are removed from the report upon filing, which leaves the debtor better positioned to repay remaining or new debts—as well as the fact that filing for bankruptcy puts limits on a person’s ability to file again in the near future. For unsuccessful Chapter 13 filers, however, the cause of the rebound is less clear since they did not have debt discharged. The small rebound may be the result of debts being written off by creditors, and hence removed from the debtors’ file at the credit bureau. Over time, debtors continue to rebuild their credit back to initial levels, and at flag removal (seven years for successful Chapter 13 and ten years otherwise), there is a bump in credit scores. This bump is largest for the successful filers—jumping from around 610 to 620—and smallest for the unsuccessful Chapter 13 filers.

Benefits from the Bump
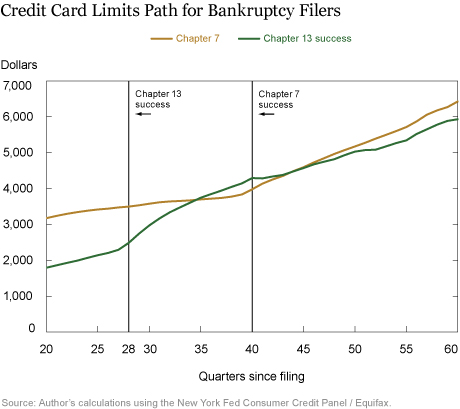
Does the bump in scores help debtors gain access to credit? In the next chart, I plot the total credit card limits for the two successful bankruptcy filing groups, zoomed in at twenty quarters after filing and onward. While there is no immediate, corresponding jump in the credit limits for either group, successful Chapter 7 and Chapter 13 filers see an inflection in the credit limits, suggesting that debtors are able to translate the higher credit scores into a larger amount of credit.

Costs of Flag Removal?
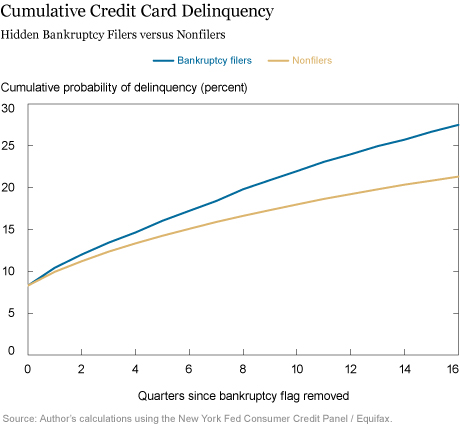
Given the additional credit that comes with removal of the bankruptcy flag, are those with “hidden” bankruptcy flags (that is, those with flags just removed) more likely to default in the future than random non-bankruptcy filers? To make a fair comparison, we match individuals with hidden flags to nonfilers with identical credit scores and age and in the same time period. If bankruptcy flags were providing no important information to creditors, we should see no difference in default rates. Alternatively, if the removal of the bankruptcy flags hid valuable information from creditors, default rates for bankruptcy filers should be higher. Indeed, debtors with a “hidden” bankruptcy flag are much more likely to become delinquent on their credit cards than are non-bankruptcy filers (see chart below).

Further Results
These results highlight several important facts about bankruptcy filers and the effect of bankruptcy flag removal. First, the addition of the bankruptcy flag typically only occurs after consumers’ credit scores have fallen tremendously, and, in fact, debtors’ scores tend to improve afterward. Second, the removal of the flag does cause creditors to view these debtors as more creditworthy. Third, it appears that “hidden” bankruptcy flags could be informative.
In work with my coauthors Will Dobbie, Neale Mahoney, and Jae Song, we explore these differences further. We use the timing of the Chapter 13 flag compared with the Chapter 7 flag for successful filers, and use the Chapter 7 filers as a control group to estimate the exact effect of the Chapter 13 bankruptcy flag removal. We first confirm that bankruptcy flag removal leads to an immediate 10-point increase in credit scores, as we saw above. Then we show a $1,510 increase in credit limits and an $800 increase in credit card balances three years later. We also study a number of other outcomes, including employment.
Disclaimer
The views expressed in this post are those of the author and do not necessarily reflect the position of the Federal Reserve Bank of New York or the Federal Reserve System. Any errors or omissions are the responsibility of the author.

Paul Goldsmith-Pinkham is an economist in the Federal Reserve Bank of New York’s Research and Statistics Group.
How to cite this blog post:
Paul Goldsmith-Pinkham, “Do Credit Markets Watch the Waving Flag of Bankruptcy?” Federal Reserve Bank of New York Liberty Street Economics (blog), May 15, 2017, http://libertystreeteconomics.newyorkfed.org/2017/05/do-credit-markets-watch-the-waving-flag-of-bankruptcy.html.


 RSS Feed
 Follow Liberty Street Economics