The Federal Reserve Bank of New York’s 2017 SCE Housing Survey indicates that expected home price growth over the next year has increased compared with twelve months earlier, and is at its highest level since the survey’s inception in 2014. Five-year growth expectations have also risen, albeit more modestly. In line with these findings, the majority of households continue to view housing as a good investment. Respondents expect slightly larger increases in mortgage rates than they did in last year’s survey. Renters’ perceived access to mortgage credit continued to ease.
This latest survey marks the fourth installment of the SCE Housing Survey, which has been fielded annually every February since 2014 and is part of the broader Survey of Consumer Expectations. Results are presented in the SCE Housing Survey interactive web feature, which presents time trends for variables of interest for the overall sample as well as for various demographic groups. As in previous years, we are also releasing a detailed background report that describes the sample and presents summary statistics for a larger number of questions.
The primary goal of the SCE Housing Survey is to provide rich and high-quality information on consumers’ experiences, behavior, and expectations related to housing. The survey, among other things, collects data on households’ perceptions and expectations for home price growth, intentions regarding moving and buying in the future, and access to credit. For homeowners, it collects detailed information on their mortgage debt, past actions and experiences—such as foreclosure or refinancing—and expectations regarding future actions—such as taking out new debt or investing in the home. For renters, among other things, the survey elicits preferences for owning and perceptions regarding the ease of obtaining a mortgage.
Below, we discuss three findings from this year’s survey.
Home Price Expectations
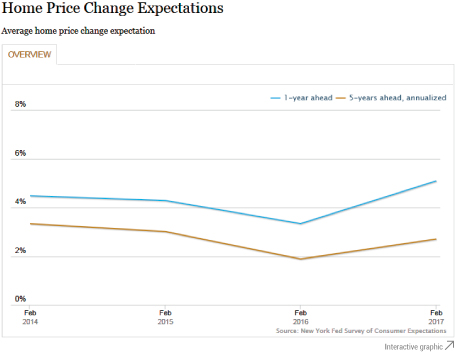
We asked our survey respondents to estimate the value of a typical home in their zip code, and what they think the value of that home would be one and five years from today. Based on these responses, we can compute the expected annual change in home prices over the next one- and five-year periods, respectively. The evolution of the mean expectation over the two horizons is shown in the chart below. The mean expected change in home prices over the next one-year period in the 2017 survey is 5.1 percent, roughly 1.8 percentage points higher than last year and also well above the values in 2014 and 2015. The median forecast (available under the “Detail” tab in our interactive chart) shows a slightly smaller increase of about 1.1 percentage points compared with last year, and confirms the new peak among our four survey years.
The mean expectation over the longer five-year horizon also increased compared with last year’s survey, but remains at or below the levels reached in 2014 and 2015. Thus, our respondents expect a slightly more marked slowdown in medium-term house price growth after an initial continuation of the rapid price growth in recent years.
Potential Credit Access for Renters
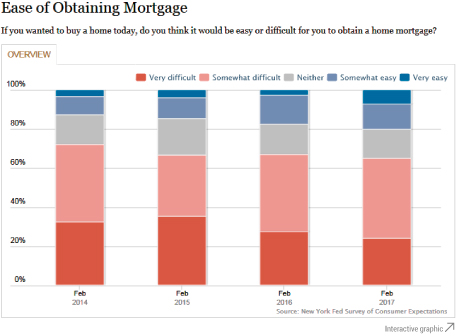
The renters among our survey respondents are asked whether they think it would be easy or difficult for them to obtain a mortgage if they wanted to buy a home today. Since the beginning of our survey in 2014, roughly two-thirds of renters have said it would be at least somewhat difficult—a factor we have discussed previously as contributing to the relatively muted flows into homeownership in recent years. Looking at the distribution of responses across the four survey years (see the chart below) shows that, while the overall pattern has remained stable, there has been a gradual move toward easier perceived credit access for renters: for instance, this year 20 percent of renters said it would be somewhat or very easy for them to obtain a mortgage if they wanted to, compared with fewer than 15 percent in 2014 and 2015. These perceptions are in line with other measures of mortgage credit standards that also show a gradual easing in recent years (see, for example, the Senior Loan Officer Opinion Survey or this credit availability measure).
Probability of Refinancing
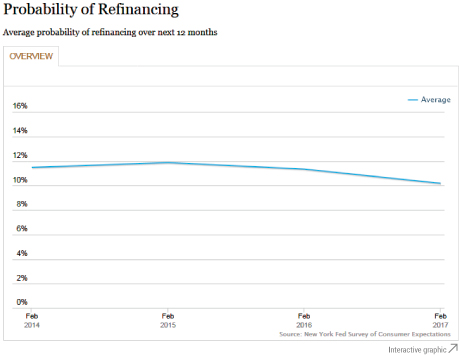
Homeowners in the sample with a mortgage on their primary residence were asked about the likelihood of refinancing the mortgage in the next twelve months. The average reported likelihood in the most recent survey was 10.2 percent, the lowest reading since 2014. The response to this question has hovered in a narrow range between 10 and 12 percent since the start of the series in 2014, as shown in the chart below. In this year’s survey, the most common reasons given for not refinancing were satisfaction with the current mortgage terms, insufficient savings on the monthly payment to warrant refinancing, aversion to taking out a new long-term loan, and the high upfront costs of refinancing. Of those respondents who do not plan to refinance, a higher proportion reported being satisfied with their current mortgage terms in the 2017 survey than did in 2016 (58 percent versus 46 percent). This finding is perhaps not surprising given that perceptions of current mortgage rates have moved up from the prior year’s levels.
Disclaimer
The views expressed in this post are those of the authors and do not necessarily reflect the position of the Federal Reserve Bank of New York or the Federal Reserve System. Any errors or omissions are the responsibility of the authors.

Andreas Fuster is an officer in the Federal Reserve Bank of New York’s Research and Statistics Group.

Basit Zafar is an officer in the Bank’s Research and Statistics Group.

Nima Dahir is a senior research analyst in the Bank’s Research and Statistics Group.
How to cite this blog post:
Andreas Fuster, Basit Zafar, and Nima Dahir, “Just Released: 2017 SCE Housing Survey Finds Increased Optimism about Home Price Growth,” Federal Reserve Bank of New York Liberty Street Economics (blog), May 11, 2017, http://libertystreeteconomics.newyorkfed.org/2017/05/just-released-2017-sce-housing-survey-finds-increased-optimism-about-home-price-growth.html.


 RSS Feed
 Follow Liberty Street Economics
Joe: The basis for this is the following question: “If someone had a large sum of money that they wanted to invest, would you say that relative to other possible financial investments, buying property in your zip code today is a [very good; somewhat good; neither good nor bad; somewhat bad; very bad] investment?” More than 60% of the respondents choose very or somewhat good. We do not ask respondents why they gave their selected answer. However, research suggests that at least to some extent, the optimism about housing may be driven by extrapolation from recent house price growth (see https://www.newyorkfed.org/medialibrary/media/research/staff_reports/sr798.pdf; section A.3 provides direct evidence on this particular question).
Thanks for the research. What was the basis for consumers considering housing a good investment?