During the 2007-08 financial crisis, the Fed established lending facilities designed to improve market functioning by providing liquidity to nondepository financial institutions—the first lending targeted to this group since the 1930s. What was the financial condition of the dealers that borrowed from these facilities? Were they healthy institutions behaving opportunistically or were they genuinely distressed? In published research, we find that dealers in a weaker financial condition were more likely to participate than healthier ones and tended to borrow more. Our findings reinforce the importance of Bagehot’s principle that the lender-of-last resort should lend only against high-quality collateral and at a penalty rate so as to discourage unneeded or opportunistic borrowing.
Lender-of-Last-Resort Facilities for Dealers
In response to the difficulties dealers faced in borrowing in short-term funding markets, the Fed created two lender-of-last-resort (LOLR) facilities—the Term Securities Lending Facility (TSLF) and the Primary Dealer Credit Facility (PDCF). The TSLF allowed primary dealers to swap less liquid collateral for liquid Treasury securities for a twenty-eight-day term at an auction-determined fee. Since the Treasury securities were easier to borrow against than the less liquid collateral dealers swapped for them, the facility helped alleviate dealers’ funding constraints. The TSLF operated two schedules of auctions, in which the second (Schedule 2) allowed for a broader, less liquid range of collateral than the first (Schedule 1). In contrast to the TSLF, the PDCF allowed primary dealers to borrow funds from the Fed on a daily basis at a set fee against a broader range of collateral.
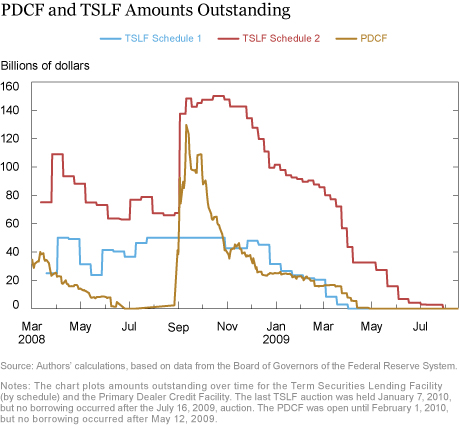
Borrowing from the TSLF grew quickly, from an initial Schedule 2 auction size of $75 billion in March 2008 to a peak of $200 billion (Schedules 1 and 2 combined) after the crisis intensified with the Lehman bankruptcy in September 2008 (see chart below). Demand for TSLF borrowing declined as private funding markets improved, and then dropped to zero after the July 16, 2009, auction. The last TSLF auction was held January 7, 2010, and authorization for lending officially expired on February 1, 2010.
Unlike the TSLF, the PDCF was used sparingly before the Lehman bankruptcy, with initial borrowing amounts of less than $40 billion. After Lehman, borrowing rose sharply to a peak of almost $130 billion in late September 2008, before tailing off as market conditions improved. Authorization for the PDCF also expired on February 1, 2010.
The Relationship between Dealer Financial Condition and Borrowing under the Facilities
Who borrowed from the facilities—the financially healthy dealers or the more distressed ones? We gauge the financial condition of a dealer by its cumulative equity return from a date before the crisis (January 2, 2007), and by its market leverage, defined as the sum of the market value of equity and the book value of other liabilities divided by the market value of equity (see the paper on which this post is based for details). These measures indicate the market’s assessment of firms’ financial health and, in particular, firms’ equity relative to non-equity liabilities. Market-based measures may be more informative of dealer financial health than regulatory capital levels.
We find that primary dealers with lower equity returns and higher leverage were more likely to participate in both the TSLF and the PDCF. The chart below illustrates the negative relation between cumulative equity return and TLSF Schedule 1 borrowing. The correlation between lower equity returns and participation is strong: a decrease of one standard deviation in equity return (-26 percent) increases a dealer’s likelihood of borrowing in a given auction by 12 percentage points. Firms in a weaker financial condition also tended to borrow larger quantities and, in TSLF auctions, they bid higher interest rates.
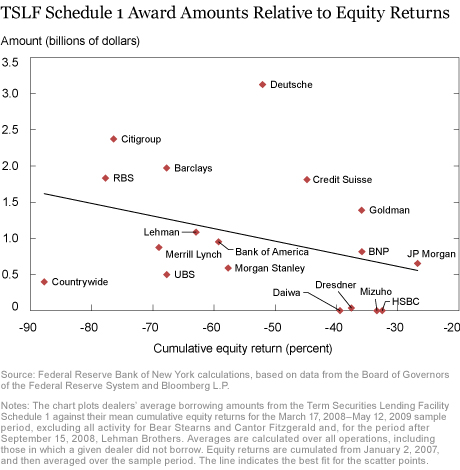
Weaker dealers likely faced greater private funding costs for less liquid collateral and, consequently, may have been more inclined to borrow from facilities that would accept such collateral. In fact, we find that dealers with lower equity returns were more likely to participate in, and borrow significantly larger amounts from, TSLF Schedule 2 auctions, for which lower-quality collateral was permissible (especially after Lehman’s collapse). These dealers were also more likely to have less liquid collateral on their balance sheets before the crisis. The fact that weaker dealers had more illiquid collateral to finance is not surprising given that solvency and liquidity problems often feed on one other.
Did Dealers Value Flexibility under the PDCF?
The overnight PDCF loans were more flexible than the longer-term TSLF loans because, by rolling over their PDCF funding, firms could borrow for as long as necessary and avoid paying a fee for a twenty-eight-day loan in the TSLF. How much did borrowers value that option?
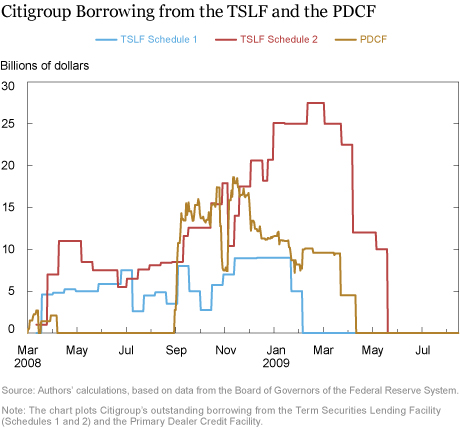
We find that heavy users of the PDCF rolled over funding frequently. However, it appears that these funds were not used to substitute for TSLF loans but rather to “top up” amounts obtained from the TSLF. Thus, what dealers valued most in the PDCF was not the flexibility of short-term borrowing per se but the access to additional funding against less liquid collateral. As an example, Citigroup borrowed heavily from both the PDCF and the TSLF (see chart below). Most of its PDCF borrowing fell within a single spell of 152 days starting on September 15, 2008, during which it continuously rolled over its funding.
Stigma
Distressed dealers may borrow less aggressively if they are concerned about the stigma associated with their borrowing (if it is revealed). Some may choose to borrow in the private markets and pay more as a consequence. However, an auction facility may mitigate stigma since dealers participate together rather than individually. In contrast, in a standing facility—such as the discount window—financial institutions borrow from the Fed bilaterally. We examine if stigma is evident in borrowing from the PDCF, which was a standing facility, as opposed to the TSLF, in which loans were auctioned.
The chart below shows that the implied TSLF Schedule 2 borrowing rate exceeded the PDCF rate in September and October 2008, even though the PDCF offered more flexibility in borrowing terms and pledgeable collateral—advantages that should have made dealers willing to pay more (as indeed they did at other times). Borrowers’ willingness to pay a premium at the TSLF may suggest that borrowing from the PDCF did carry a stigma, similar to that observed with discount window borrowing. Alternatively, the premium might reflect a willingness to pay more to lock in longer-term funding by borrowers who may have been concerned that they would be unable to roll over their PDCF loan if their financial condition deteriorated rapidly.
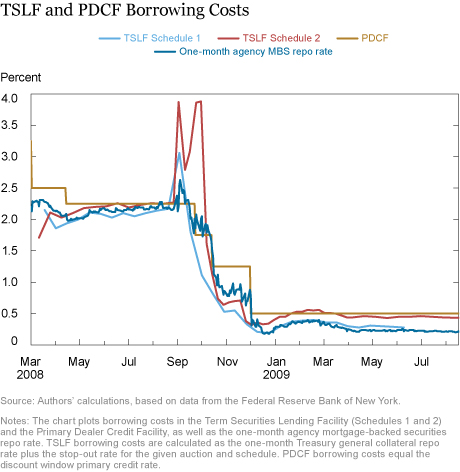
Additional evidence touching on the stigma issue is found in the chart. Note that the one-month agency MBS repo rate exceeded the implied TSLF Schedule 1 borrowing rate from October 2008 to January 2009 at the height of the crisis (the two rates were about the same outside this period). This finding is also surprising: since agency MBS was accepted in the TSLF Schedule 1 operations, one would expect the agency MBS repo rate to equal the TSLF Schedule 1 borrowing rate. Dealers’ apparent willingness to pay more to borrow in the private market than to borrow from the TSLF may also reflect a fear of stigma.
Implications for the Lender-of-Last-Resort
Central banks limit borrowing by establishing standards for collateral quality, by charging a penalty rate, and by monitoring borrowers’ financial health. However, in a crisis, when financial conditions change rapidly, regulators face the difficult challenge of knowing which signals to rely on. Our results show that market signals of financial health (such as equity prices) predicted how much dealers borrowed from the Fed’s liquidity facilities during the crisis and that financially weaker firms, rather than opportunistic ones, were the heaviest users.
Disclaimer
The views expressed in this post are those of the authors and do not necessarily reflect the position of the Federal Reserve Bank of New York or the Federal Reserve System. Any errors or omissions are the responsibility of the authors.
Viral V. Acharya is a deputy governor of the Reserve Bank of India; he is on leave from NYU Stern School of Business, where he is C. V. Starr Professor of Economics.

Michael J. Fleming is a vice president in the Federal Reserve Bank of New York’s Research and Statistics Group.

Warren B. Hrung is an officer in the Bank’s Research and Statistics Group.

Asani Sarkar is an assistant vice president in the Bank’s Research and Statistics Group.
How to cite this blog post:
Viral V. Acharya, Michael J. Fleming, Warren B. Hrung, and Asani Sarkar, “Which Dealers Borrowed from the Fed’s Lender-of-Last-Resort Facilities?” Federal Reserve Bank of New York Liberty Street Economics (blog), May 10, 2017, http://libertystreeteconomics.newyorkfed.org/2017/05/which-dealers-borrowed-from-the-feds-lender-of-last-resort-facilities.html.


 RSS Feed
 Follow Liberty Street Economics