The New York Fed’s recently released Quarterly Trends for Consolidated U.S. Banking Organizations (QT report) confirms that bank loan portfolios look a lot healthier than they did just a few years ago, reflecting the sustained economic recovery from the Great Recession. In this post, we sharpen the focus to look at bank loan performance in more detail, using more disaggregated charts added to the QT report this quarter.
Looking Healthier
The QT report tracks two key measures of bank loan performance. The “nonperforming loan ratio” measures the fraction of the loan portfolio which is past due at least ninety days or in nonaccrual status. The “net charge-off rate” measures the annualized dollars of final credit losses recognized by banks on their loans, divided by the size of the loan portfolio.
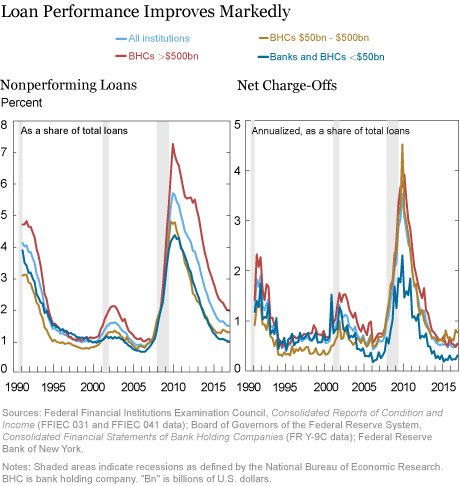
By both metrics, aggregate loan performance has improved markedly in recent years (see charts below). This reflects a combination of factors, including a sustained period of growth and declining unemployment, the eventual resolution of loans that went bad during the Great Recession, and tighter post-crisis underwriting standards for some types of loans such as residential mortgages.

The charts show that loan performance has improved for both small and large banks, although it is most pronounced for the six largest bank holding companies (BHCs) with more than $500 billion in total assets (marked by the red lines in the charts).
A Fine-Tooth Comb
To date, the QT report has only tracked loan balances and performance for five broad categories: residential real estate, commercial real estate, commercial and industrial loans, consumer loans, and other loans. Starting this quarter, the report also breaks down loan portfolios into finer subcategories. The new content provides a richer picture of bank loan portfolios and can highlight divergent trends and cyclical properties across subcategories. Here are a couple of examples.
Commercial Real Estate Loans
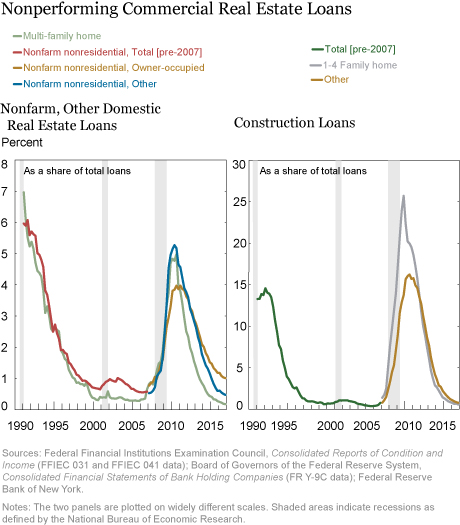
Regulators and market participants have recently voiced concerns about rising risk in commercial real estate lending. To better track this market, the QT report now separately breaks out the performance of mortgages backed by several types of “income-producing” commercial properties and of construction loans backed by properties still under construction or development. The charts below plot the nonperforming loan ratio for these different categories.

Looking at past business cycles, performance of all types of bank commercial real estate loans deteriorated sharply during the 1991 recession and the 2007-09 Great Recession, and, to a lesser extent, in the 2001 recession. Loan performance on construction loans, however, is much more sensitive to the economic cycle (see right panel) than is the performance for commercial real estate backed by income-producing properties (left panel). Only about 4 to 5 percent of loans backed by income-producing properties were delinquent even at the peak in the wake of the Great Recession. But for loans used to finance the construction of new single-family homes, more than 25 percent of borrowers were behind on their payments at the end of 2009. And the nonperforming loan ratio for other construction loans also peaks at a very high level in 2009, at around 16 percent.
The particularly poor performance of home construction loans is likely in part due to specific features of the Great Recession: the historic collapse in housing prices and construction, with historically high vacancy rates and many abandoned housing developments across the United States. But this is only part of the story. Other types of construction loans also performed poorly during this period, and the nonperforming construction loan ratio also spikes disproportionately during the earlier 1991 recession.
Why are construction loans so much riskier? A key reason is that a new real estate development is generally a “spec” (speculative) investment not currently producing a stream of lease income to meet mortgage payments. The ultimate value of the development is often highly uncertain because the ultimate stream of lease payments depends on future local economic conditions when the building is completed. Furthermore, real estate development is often concentrated in areas experiencing rapid real estate price appreciation; these areas may also be more likely to experience a larger decline in real estate prices if a downturn comes.
Consumer Loans
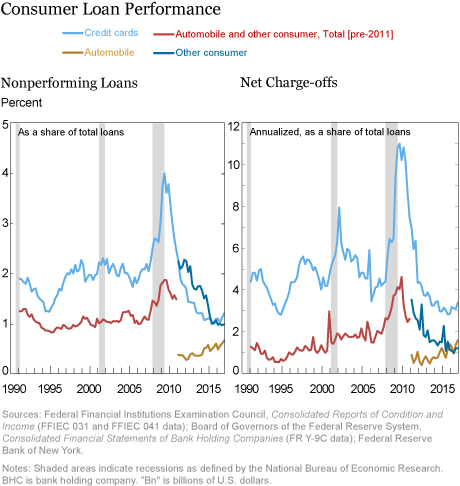
The QT report’s new charts break down consumer loan performance for three categories: credit cards, auto loans, and other consumer loans (including student, single payment, and installment loans).

Loan performance for credit cards tracks the business cycle more closely than for auto and other consumer loans, particularly outside the Great Recession period. And interestingly, auto loan delinquency and loss rates have been trending upward since that sector was first broken out in 2011, bucking the overall trend towards improved bank loan performance. This increase is consistent with anecdotes about declining auto lending standards, and findings based on the New York Fed’s Quarterly Report on Household Debt and Credit that auto balances of subprime borrowers have generally been growing in recent years. However, it is important to note that auto loan delinquency rates for banks remain under 1 percent, well below the delinquency ratio for all auto loans (from a universe of lenders including auto finance companies) of 3.8 percent (based on the most recent New York Fed Consumer Credit Panel/Equifax data).
Go to the Source
The discussion and charts above provide just a taste of the new, more detailed content in the QT report. Interested readers should go to the source to see (many!) more charts, and to download and analyze data on their own.
Disclaimer
The views expressed in this post are those of the authors and do not necessarily reflect the position of the Federal Reserve Bank of New York or the Federal Reserve System. Any errors or omissions are the responsibility of the authors.
 James Vickery is an assistant vice president in the Federal Reserve Bank of New York’s Research and Statistics Group.
 April Meehl is a senior research analyst in the Bank’s Research and Statistics Group.
How to cite this blog post:
James Vickery and April Meehl, “Just Released: Bank Loan Performance Under the Microscope,” Federal Reserve Bank of New York Liberty Street Economics (blog), June 1, 2017, http://libertystreeteconomics.newyorkfed.org/2017/06/just-released-bank-loan-performance-under-the-magnifying-glass.html.


 RSS Feed
 Follow Liberty Street Economics