The New York Fed for the first time released its Survey of Consumer Expectations (SCE) Labor Market Survey which focuses on individuals’ experiences and expectations in the labor market. These data have been collected every four months since March 2014 as part of the SCE. It is being introduced now because the module has enough historical data to reveal notable trends. In this post we introduce the SCE Labor Market Survey and highlight some of its features.
This data set is unique in many ways. Regarding experiences, we collect information on not only individuals’ current job characteristics—data that other surveys such as the Current Population Survey collect as well—but also on search behavior, and the job offers that individuals have recently received. In addition, we collect rich expectations data, including on the respondents’ anticipated job offers and labor market transitions, as well as on their reservation wages. No other data source collects real-time information about such a comprehensive set of both labor market experiences and expectations for the same individuals over time, at a regular frequency, and for a nationally representative sample of respondents.
Survey Overview
The SCE Labor Market Survey collects detailed information about the respondent’s current (or most recent) job. Respondents are asked about job transitions, as well as about their job search effort and outcomes (number of job offers and offer wages), over the past four months. Individuals who are currently employed are also asked about their level of satisfaction with wages, nonwage benefits, and their prospects for advancement at their current job.
We also ask the respondents to look ahead, eliciting data on their expectations about job transitions over the next four months. In addition, respondents are asked about the likelihood of receiving at least one job offer over the next four months, the expected number of offers, and the expected wages for these offers. We also elicit the respondents’ “reservation wage,” defined as the lowest wage or salary they would accept for a new job. Respondents also report their expected likelihood of working beyond ages 62 and 67—questions similar to those asked in the Health and Retirement Study.
The data, together with a companion set of interactive charts that show a subset of the data that we collect will be published every four months on the New York Fed’s Center for Microeconomic Data website. As with other components of the SCE, we report statistics not only for the overall sample, but also by various demographic categories, namely age, education, gender, and household income. The underlying micro (individual-level) data for the full survey will be made available with a lag.
The remainder of this post discusses two series from this new data set. Interested readers can view additional charts on the release webpage.
Job Offers
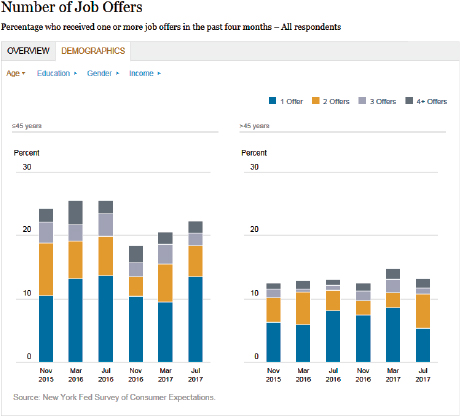
The job offer arrival process is key in understanding the evolution of the unemployment rate, as well as wage growth. The chart below depicts the percentage of respondents who received one, two, three, and four or more offers over the past four months. The series is broken down by age. As the chart indicates, younger individuals (age 45 or less) are significantly more likely to have received one or more job offers over the previous four months than their older counterparts. For example, in July, 22 percent of younger respondents reported receiving at least one offer in the past four months, compared to about 13 percent of older respondents.

Job Transitions
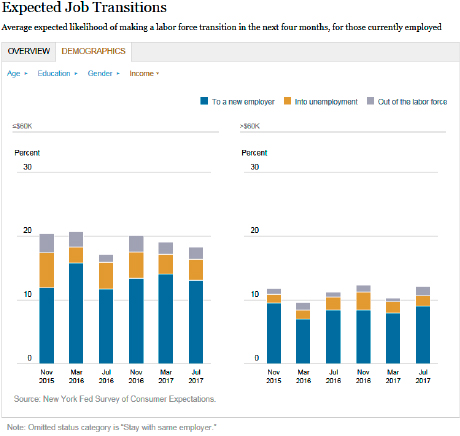
Labor market transition rates (such as the job-to-job or the employed-to-unemployed transition rates) are some of the most important metrics that summarize the dynamics of the labor market. The chart below reports the average perceived likelihood among employed workers that they will be with a different employer, unemployed, or out of the labor force four months from now. We see that lower-income workers (those with an annual household income of $60,000 or less) assign a higher likelihood to switching jobs or transitioning into unemployment or out of the labor force entirely than higher-income respondents do.

Our analysis also indicates that these expectations predict actual transition rates, both at the aggregate and individual level (see slides 41-48 from our press briefing on this topic last year), underscoring the usefulness and need for collecting such data.
Conclusion
The SCE Labor Market Survey provides a comprehensive picture of both the expectations and experiences of individuals regarding the labor market. These data can help shed light on the dynamics and health of the labor market in real time, and provide an indication of its likely trajectory in the near term. We believe that this new data set will be valuable to policymakers and the research community alike, enabling them to understand better the workings of the U.S. labor market.
Disclaimer
The views expressed in this post are those of the authors and do not necessarily reflect the position of the Federal Reserve Bank of New York or the Federal Reserve System. Any errors or omissions are the responsibility of the authors.

John J. Conlon is a senior research analyst in the Federal Reserve Bank of New York’s Research and Statistics Group.

Gizem Kosar is an economist in the Bank’s Research and Statistics Group.

Giorgio Topa is a vice president in the Bank’s Research and Statistics Group.

Basit Zafar is a research officer in the Bank’s Research and Statistics Group.
How to cite this blog post:
John J. Conlon, Gizem Kosar, Giorgio Topa, and Basit Zafar, “Introducing the SCE Labor Market Survey,“ Federal Reserve Bank of New York Liberty Street Economics (blog), August 21, 2017, http://libertystreeteconomics.newyorkfed.org/2017/08/just-released-introducing-the-sce-labor-market-survey.html.


 RSS Feed
 Follow Liberty Street Economics